Please read tips for efficient and successful posting and posting code
ROOT Version: 6.16/00
Platform: Ubuntu 20.04
Compiler: linuxx8664gcc
Hello co-rooters!
I am trying to plot a TH2D histogram using the colz option.
I also want the contour lines for z=1, 2, 3, … and later on I’d like to add labels (i.e. z=1, z=2, etc).
I firstly draw using `colz’ and then, after I set the contours, I redraw it using 'cont3 same". Here are the differences when I only draw with ‘colz’
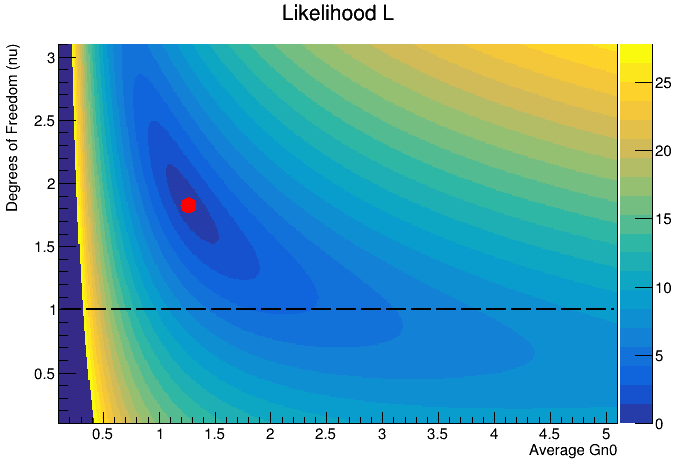
and with colz and then with cont3 same
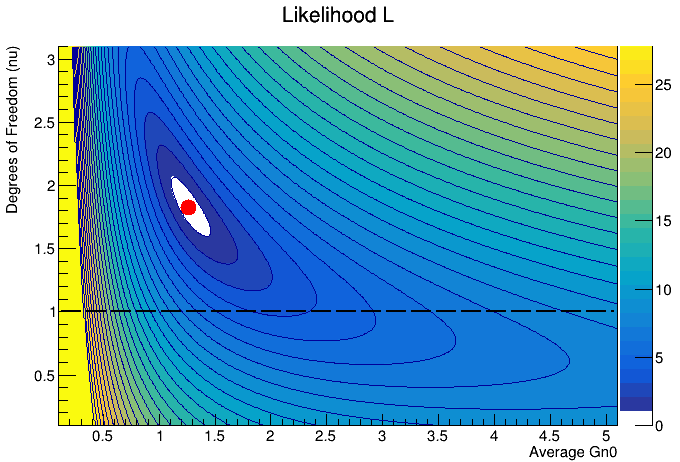
You see that around the red mark, there is white gap which is unclear where it comes from.
Any idea on why the white gap is occurring and how can I overlay the colz options with only the contour lines? Thanks in advance!
My code is (it won’t run because I couldn’t upload the dat file) :
#include "TF1.h"
#include "TF2.h"
#include "TH1D.h"
#include "TH2D.h"
#include "TPad.h"
#include "TFile.h"
#include "TTree.h"
#include "TMath.h"
#include "TGraph.h"
#include "TText.h"
#include "TGraphQQ.h"
#include "TCanvas.h"
#include "TFrame.h"
#include "TLegend.h"
#include "TLine.h"
#include "Math/PdfFuncMathCore.h"
#include <TFitResult.h>
#include "TGraphErrors.h"
#include <TMultiGraph.h>
#include "Math/Functor.h"
#include "Math/WrappedFunction.h"
#include "Math/IFunction.h"
#include "Math/Integrator.h"

#include <algorithm>


#include <vector>
#include <iostream>
#include <fstream>

using namespace std;

// Define the threshold function
double Threshold(double *x, double *par) {
    double E = x[0];
    double a = par[0];
    double b = par[1];
    return a * pow(E, b);
}

// Define the normalized chi-square PDF
double h0(double *x, double *par) {
    double Gn0     = x[0];
    double C       = par[0];
    double avg     = par[1];
    double nu      = par[2];
    double chi_pdf = C*ROOT::Math::chisquared_pdf(Gn0 / avg, nu);
    return chi_pdf;
}

void MLA() {
    // Step 1: Load data
    std::ifstream file("En_Gn0.dat");
    if (!file.is_open()) {
        std::cerr << "Error: Unable to open data file." << std::endl;
    }

    std::vector<double> energies, widths;
    double energy, width;
    while (file >> energy >> width) {
        energies.push_back(energy);
        widths.push_back(width);
    }
    file.close();

    // Step 2: Plot data with threshold
    TGraph *g = new TGraph(energies.size(), energies.data(), widths.data());
    g->SetMarkerStyle(20);
    g->SetTitle("Energy vs Neutron Widths;Energy (eV);Gn0 (meV)");
    //g->Draw("AP");

	double a = 1.8e-2;
    double b = 0.5;

	TF1 *threshold = new TF1("threshold", Threshold, *std::min_element(energies.begin(), energies.end()), *std::max_element(energies.begin(), energies.end()), 2);
    threshold->SetParameters(a, b);
    threshold->SetLineColor(kRed);
    threshold->SetTitle("Threshold");
    //threshold->Draw("LSAME");

     // Step 3: Filter data above threshold
    std::vector<double> filtered_widths;
    std::vector<double> filtered_energies;
    for (size_t i = 0; i < energies.size(); ++i) {
        if (widths[i] > Threshold(&energies[i], threshold->GetParameters())) {
            filtered_widths.push_back(widths[i]);
            filtered_energies.push_back(energies[i]);
        }
    }

    // Step 4: Define grid for nu and avg
    int    nu_points = 300 , avg_points = 500;
    double nu_min    = 0.1, nu_max     = 3.1;
    double avg_min   = 0.1, avg_max    = 5.1;

    TH2D *h_likelihood      = new TH2D("h_likelihood"     , "Likelihood L;Average Gn0;Degrees of Freedom (nu)", avg_points, avg_min, avg_max, nu_points, nu_min, nu_max);
    TH2D *h_likelihood_Paul = new TH2D("h_likelihood_Paul", "Likelihood L;Average Gn0;Degrees of Freedom (nu)", avg_points, avg_min, avg_max, nu_points, nu_min, nu_max);

	TF1 *f_h0 = new TF1("f_h0", h0, *std::min_element(filtered_widths.begin(), filtered_widths.end()), 3.e3, 3);

	double bin_content = 1.;
	double binCenterX  = 1.;
	double binCenterY  = 1.;
	double C           = 1.;
	double I           = 1.;
	double Lmax        = 0.;

	for (int i=0; i<avg_points; ++i){
		for (int j=0; j<nu_points; ++j){
			binCenterX = h_likelihood->GetXaxis()->GetBinCenter(i+1);
			binCenterY = h_likelihood->GetYaxis()->GetBinCenter(j+1);
			f_h0->SetParameter(0, 1.);
			f_h0->SetParameter(1, binCenterX);
			f_h0->SetParameter(2, binCenterY);
			//f_h0->SetTitle(TString::Format("f_h0_%f_%f", binCenterX, binCenterY));


			C = f_h0->Integral(*std::min_element(filtered_widths.begin(), filtered_widths.end()), 3.e3 , 1.e-10);
			f_h0->SetParameter(0, 1./C);

			I = f_h0->Integral(*std::min_element(filtered_widths.begin(), filtered_widths.end()), 3.e3 , 1.e-10);

			bin_content = 1.;
			//bin_content = TMath::Log( f_h0->Eval(filtered_widths[0]) );

			for (int k=0; k<filtered_energies.size(); ++k){
				bin_content *= f_h0->Eval( filtered_widths[k] );
			}
			h_likelihood->SetBinContent(i+1, j+1, bin_content);
		}
	}

	Lmax = h_likelihood->GetMaximum();
	// Find the bin indices of the maximum bin
	int binX, binY, binZ;
	h_likelihood->GetMaximumBin(binX, binY, binZ);

	// Get the bin centers in X and Y
	double avg_Gn0 = h_likelihood->GetXaxis()->GetBinCenter(binX);
	double nu      = h_likelihood->GetYaxis()->GetBinCenter(binY);

	cout << "Lmax = " << Lmax  << ", Avg_Gn0 = " << avg_Gn0 << ", nu = " << nu << endl;

	for (int i=0; i<avg_points; ++i){
		for (int j=0; j<nu_points; ++j){
			binCenterX = h_likelihood->GetXaxis()->GetBinCenter(i+1);
			binCenterY = h_likelihood->GetYaxis()->GetBinCenter(j+1);

			bin_content = TMath::Sqrt(2.)*TMath::Sqrt(TMath::Log(Lmax) - TMath::Log( h_likelihood->GetBinContent(i+1, j+1) ) );
			h_likelihood_Paul->SetBinContent(i+1, j+1, bin_content);
		}
	}

	h_likelihood_Paul->Draw("colz");

	// Find the maximum bin content
    double zMax = h_likelihood_Paul->GetMaximum();

    //Define sigma levels for contour lines up to zMax
    const int nLevels = zMax;  // Number of levels
    double sigmaLevels[nLevels];
    for (int i = 0; i < nLevels; ++i) {
        sigmaLevels[i] = zMax * (i + 1.0) / nLevels;
    }

    //Set contour levels and draw the contours
    h_likelihood_Paul->SetContour(nLevels, sigmaLevels);
    h_likelihood_Paul->Draw("CONT3 same");

	TGraph *g_Lmax = new TGraph(1);
	g_Lmax->SetPoint(0, avg_Gn0, nu);
	g_Lmax->SetMarkerStyle(20);
	g_Lmax->SetMarkerSize(2.);
	g_Lmax->SetMarkerColor(kRed);
	g_Lmax->Draw("Psame");

	TF1 *f_nu1 = new TF1("f_nu1", "1", avg_min, avg_max);
	f_nu1->SetLineColor(kBlack);
	f_nu1->SetLineWidth(2);
	f_nu1->SetLineStyle(9);
	f_nu1->Draw("Lsame");

}