First post & major ROOT newbie alert / disclaimer.
I am trying to fit some normally distributed data using
int nbins = 200;
int histmin = <whatever it is calculated to be>;
int histmax = <whatever it is calculated to be>;

 TH1F *hist1 = new TH1F("Data Histogram","Data Histogram",nbins,histmin-1,histmax+1);//instantiate histogram

    rewind(datafile);
    for(int i=0;i<nlines;i++){
        fscanf(datafile,"%f",&value);//read in data
        hist1->Fill(value);
    }


    hist1->Fit("gaus");
    hist1->Draw();
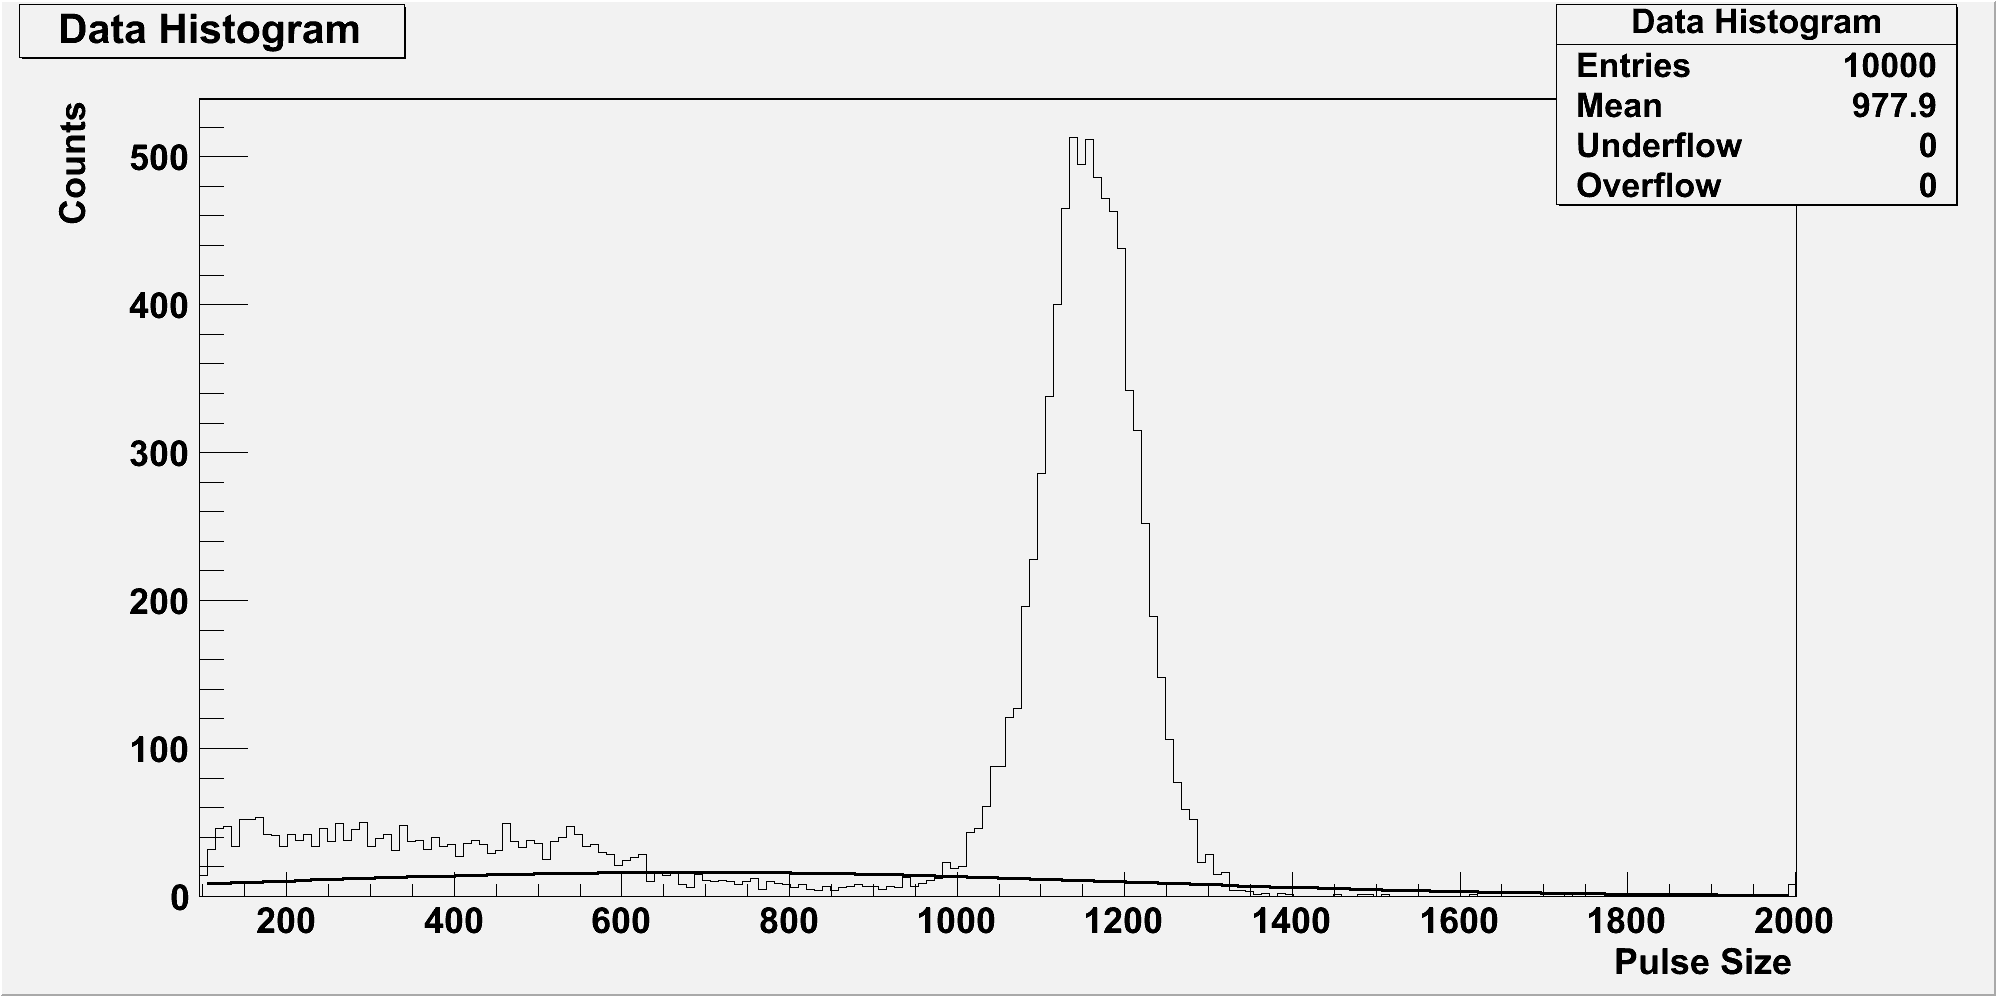
which works well. However, when there is some noise on the data to the left of the peak, the fit will often fail and fit the Gaussian to the noise rather than the data (even though there is far far more data than noise). Anyway, I have been told that this can be got around by using a constrained fit as I know roughly what the mean and rms will be. However, I don’t know how to constrain the fit on a normal histogram fit.
I found this: http://root.cern.ch/root/htmldoc/TFractionFitter.html but this doesn’t seem to be quite right as it is not fitting a normal function like fit(“gaus”) does. How can I constrain a normal function fit?
you can try to fix the mean (or sigma) or to restrict its range around your known values. You can do this easily with:
Otherwise you can do a constrained fit, using the likelihood function modified by adding a constrained term (for example a gaussian distribution around the mean parameter). In Roofit this can be done easily. in ROOT you will have to write the likelihood function yourself.
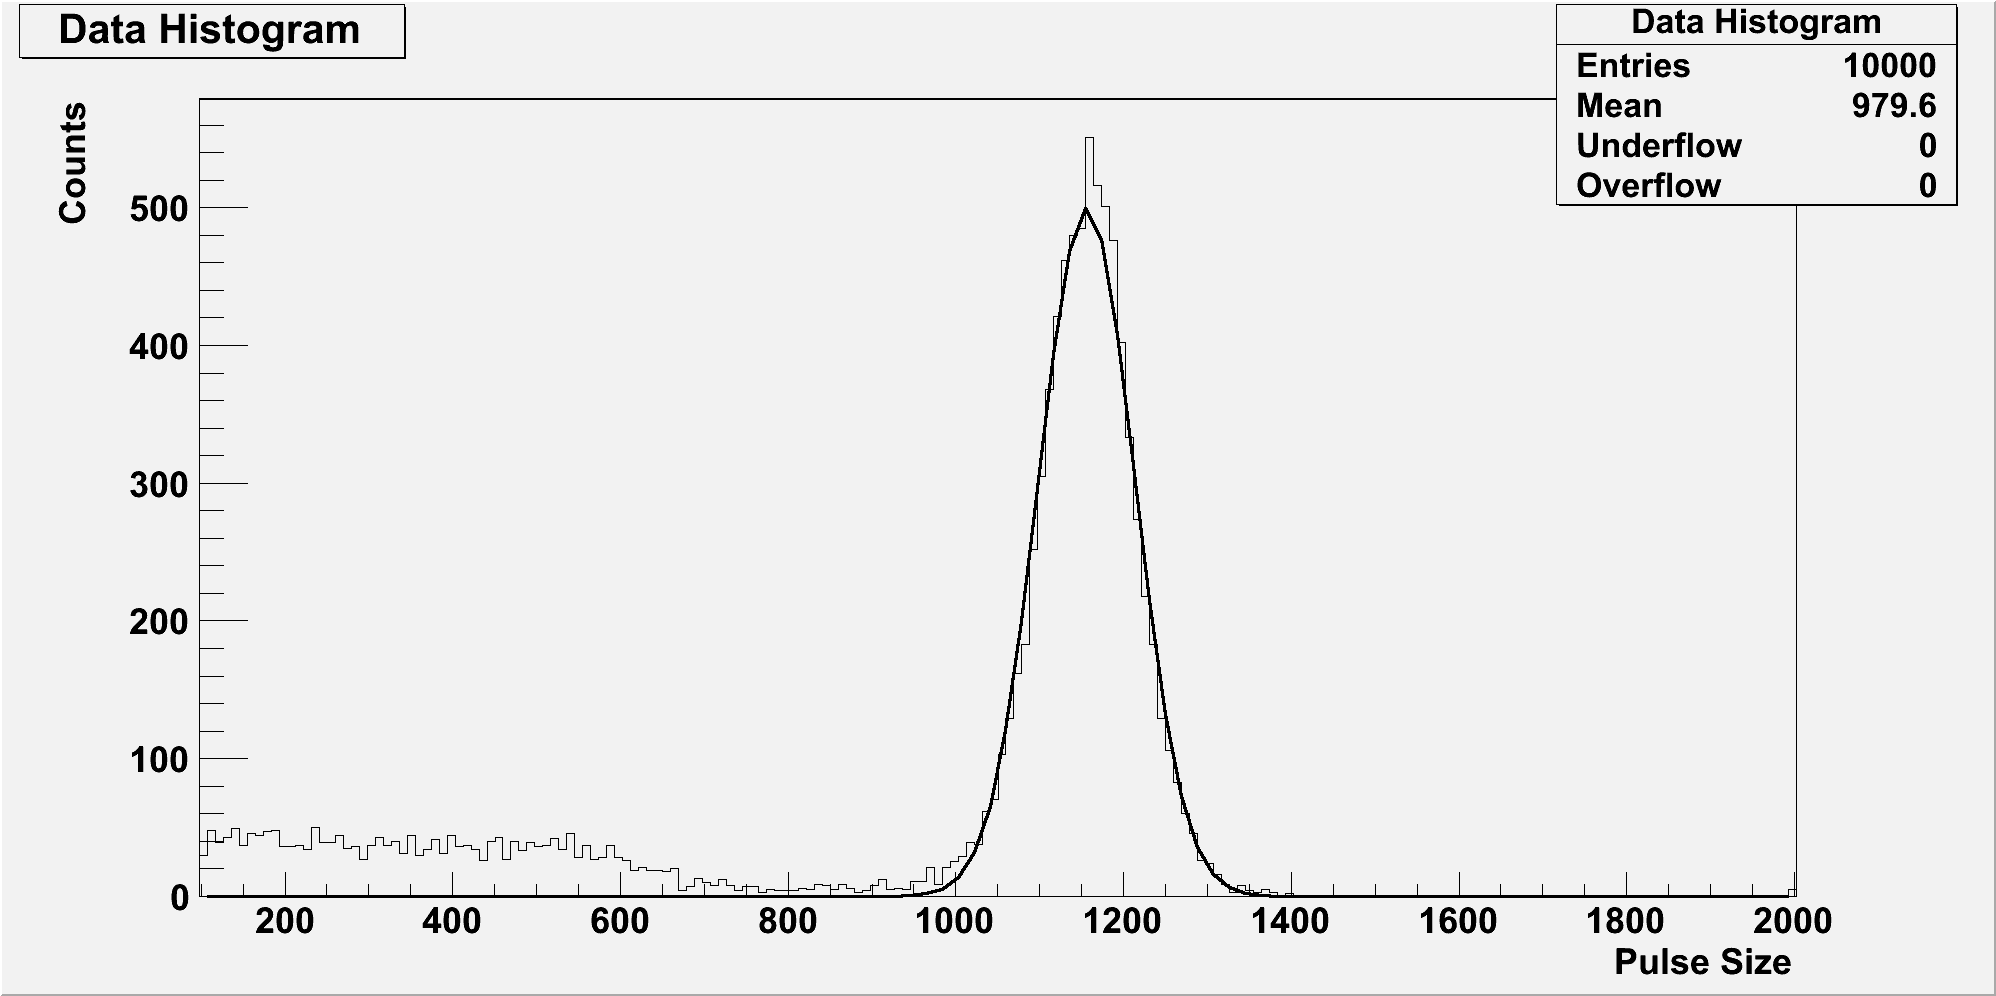
So I can see that the constraint is working, I just don’t understand why it won’t fit it to the Gaussian that’s clearly right there, within the range, and much bigger than the noise. For other, extremely similar data sets it will fit perfectly, like so:
So I guess my question is really not “how do I constrain the fit”, but why does the fit sometimes fail so dramatically. There is no overflow or underflow that it is trying to fit, so I am at a loss to explain why it doesn’t work. Any ideas?
Incidentally, I don’t know when using hist1->Fit(constrained_gaus,"B"); what the ,“B” part does, but if I use that option the fit goes completely flat and all fit parameters are returned as 0.000
Also, the dataset is available below if you want to see if this problem is replicable. I am using 200 bins, and the full code I’m using is below:
int main(int argc, char *argv[])
{
	if (argc!=4){
		printf("\n\nExpected number of command line parameters not found\n\n");
		printf("Form is: this_exe.exe FULL_PATH_TO_FILE NumberOfBins FULL_PATH_TO_OUTPUTFILE\n");
		printf("eg GetLandaus.exe C:\\CCD\\WaferID\\pulseheights.txt 200 C:\\CCD\\WaferID\\MVP.txt \n");
		return 1;
	}

	char DataFilePath[200];
	strcpy(DataFilePath, argv[1]); //read in data file location from command line parameter
	int nbins;
	sscanf(argv[2],"%d",&nbins);
	char OutFilePath[200];
	strcpy(OutFilePath, argv[3]);

	float value;
	FILE *datafile=fopen(DataFilePath,"r");

	int nlines = 0;//calculate file length
	float histmin = 4000000000.;	//a big number
	float histmax = 0.;				//a small number
	while (fscanf(datafile,"%f",&value)==1) {
		if (value>histmax){
			histmax=value;
		}
		if (value<histmin){
			histmin=value;
		}
		nlines++;
	}

	TH1F *hist1 = new TH1F("Data Histogram","Data Histogram",nbins,histmin-1,histmax+1);//instantiate histogram

	rewind(datafile);
	for(int i=0;i<nlines;i++){
		fscanf(datafile,"%f",&value);//read in data
		hist1->Fill(value);
	}

	//create canvas and display
	TCanvas *c1 = new TCanvas("c1","Histogram 1",2000,1024);
	gStyle->SetOptStat(110111);//sets histogram style to display overflow and underflow bins


	double displaymin = histmin-1;
	double displaymax = histmax+1;

	hist1->SetAxisRange(displaymin,displaymax);
	hist1->SetMinimum(0);
	hist1->SetXTitle("Pulse Size");
	hist1->SetYTitle("Counts");

	double meanMin, meanMax; //constrain the fit
	meanMin = .6 * hist1->GetBinCenter(hist1->GetMaximumBin());
	meanMax = 1.4* hist1->GetBinCenter(hist1->GetMaximumBin());

	printf("\nmax: %f\nmin: %f\n",meanMax,meanMin); //check the constraints are in the right place - they are

	TF1 *constrained_gaus = new TF1("constrained_gaus","gaus");
	constrained_gaus->SetParLimits(1,meanMin, meanMax);

	hist1->Fit(constrained_gaus); // using the hist1->Fit(constrained_gaus,"B"); gives no fit whatsoever
	hist1->Draw();

	double mean = constrained_gaus->GetParameter(1);
	double meanerror = constrained_gaus->GetParError(1);

	FILE *outfile;
	outfile = fopen(OutFilePath, "w");
	fprintf(outfile, "%f\n%f\n", mean,meanerror);

	c1->SaveAs("C:\\CCD\\LandauHistogram.png");
	system("C:\\CCD\\LandauHistogram.png");
	return 0;
}
In the case of predefined functions, like “gaus” or “landau” the initial fit parameters are computed automatically.
If you want to use constraints on those parameters for the pre-defined functions you need to use option “B”,
but you need also to define the initial values for all the parameters. In your case try to do:
constrained_gaus->SetParameter(0,500);
constrained_gaus->SetParameter(1,1200);
constrained_gaus->SetParameter(2,100);
// and set limits
constrained_gaus->SetParLimits(1,meanMin, meanMax);
with a console output of:
[size=85]
max: 1594.875836
min: 683.518216
FCN=8998.38 FROM MIGRAD STATUS=CONVERGED 180 CALLS 181 TOTAL
EDM=6.01293e-010 STRATEGY= 1 ERROR MATRIX UNCERTAINTY
0.2 per cent
EXT PARAMETER STEP FIRST
NO. NAME VALUE ERROR SIZE DERIVATIVE
1 Constant 6.76772e-030 2.13099e-031 -8.07777e-034 -2.28069e+026
2 Mean 1.20000e+003 7.04379e+002 -0.00000e+000 0.00000e+000
3 Sigma 0.00000e+000 1.41421e+000 -0.00000e+000 0.00000e+000
[/size]
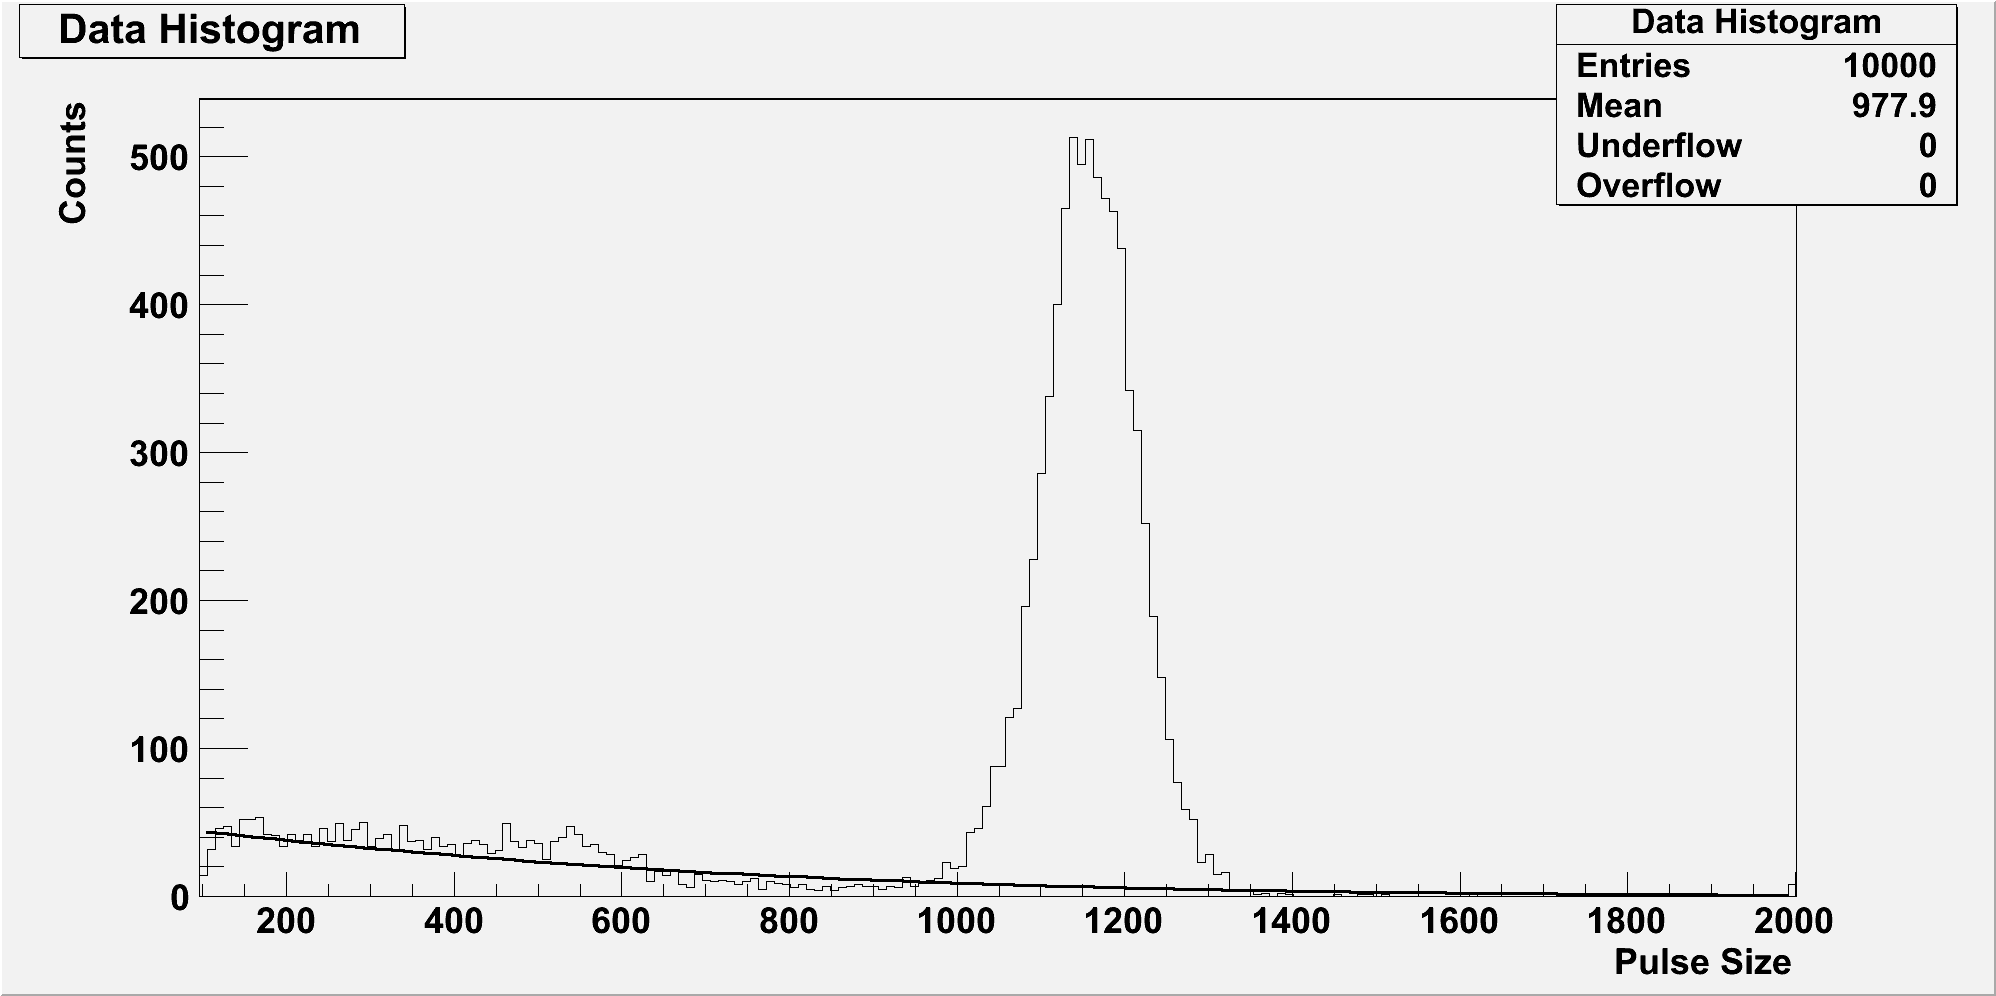
In my previous post, fitting without the “B” option, the constraint seems to be working, as you can see a Gaussian (albeit a very flat one) centred at roughly 650, as it should have been.
What I don’t understand is why, for two almost identical data sets, one succeeds and the other fails. But no, sadly defining the start parameters as you said doesn’t seem to have fixed it.
Correction: I wasn’t constraining the wrong parameter, I’d copied and pasted your code without reading it carefully! In your post you given starting values to parameters 0, 1 and 3 instead of 0, 1 and 2.
I’m only posting this in case anyone else uses this and ends up not realising. Many thanks for your help with this!