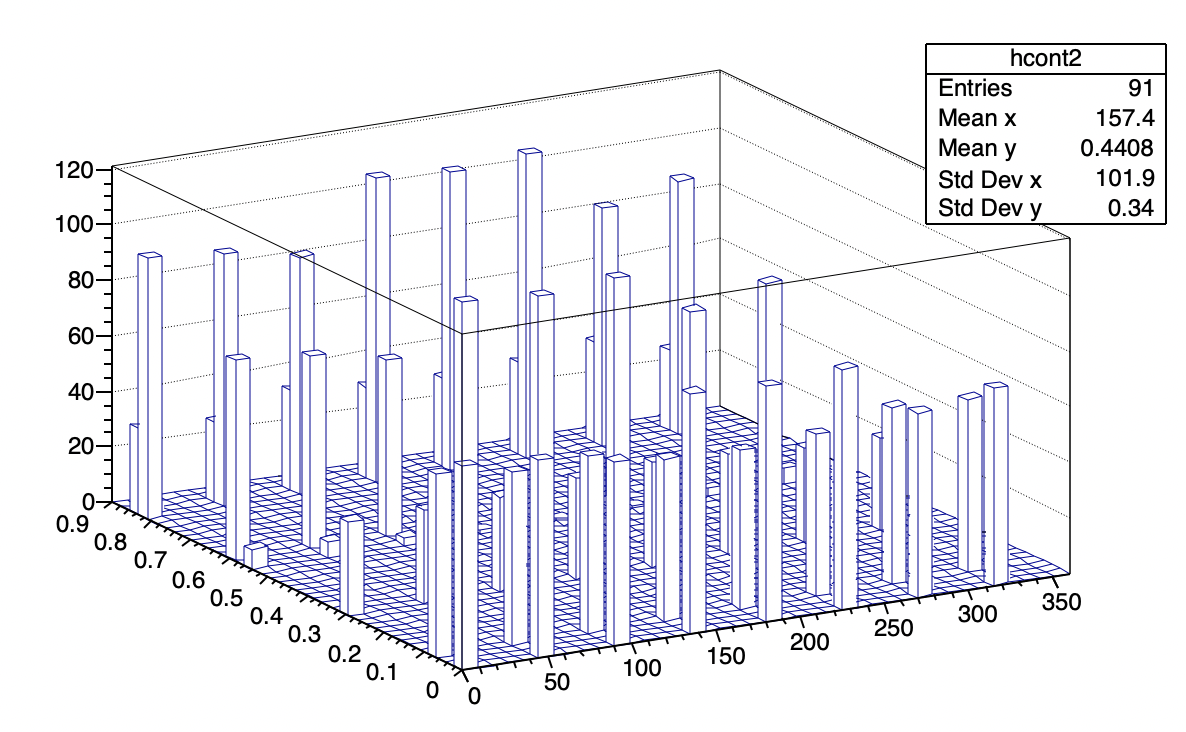
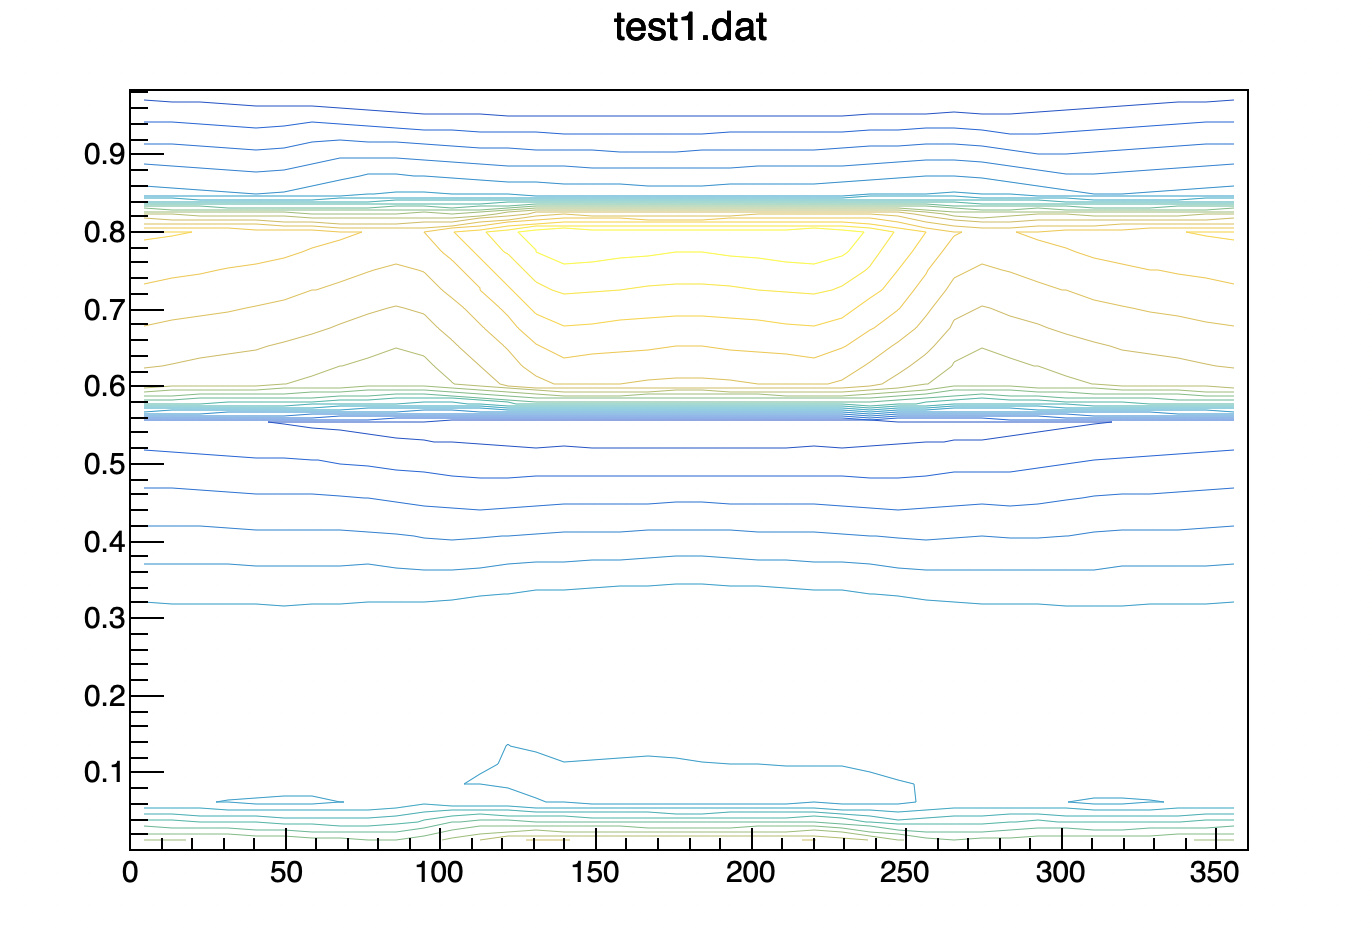
I am changing the range…then also it is not coming as in gnuplot : Range for test1.dat :
“”
TH2F *hcont2 = new TH2F(“hcont2”," ",40,0,360,40,0,0.9);
“”
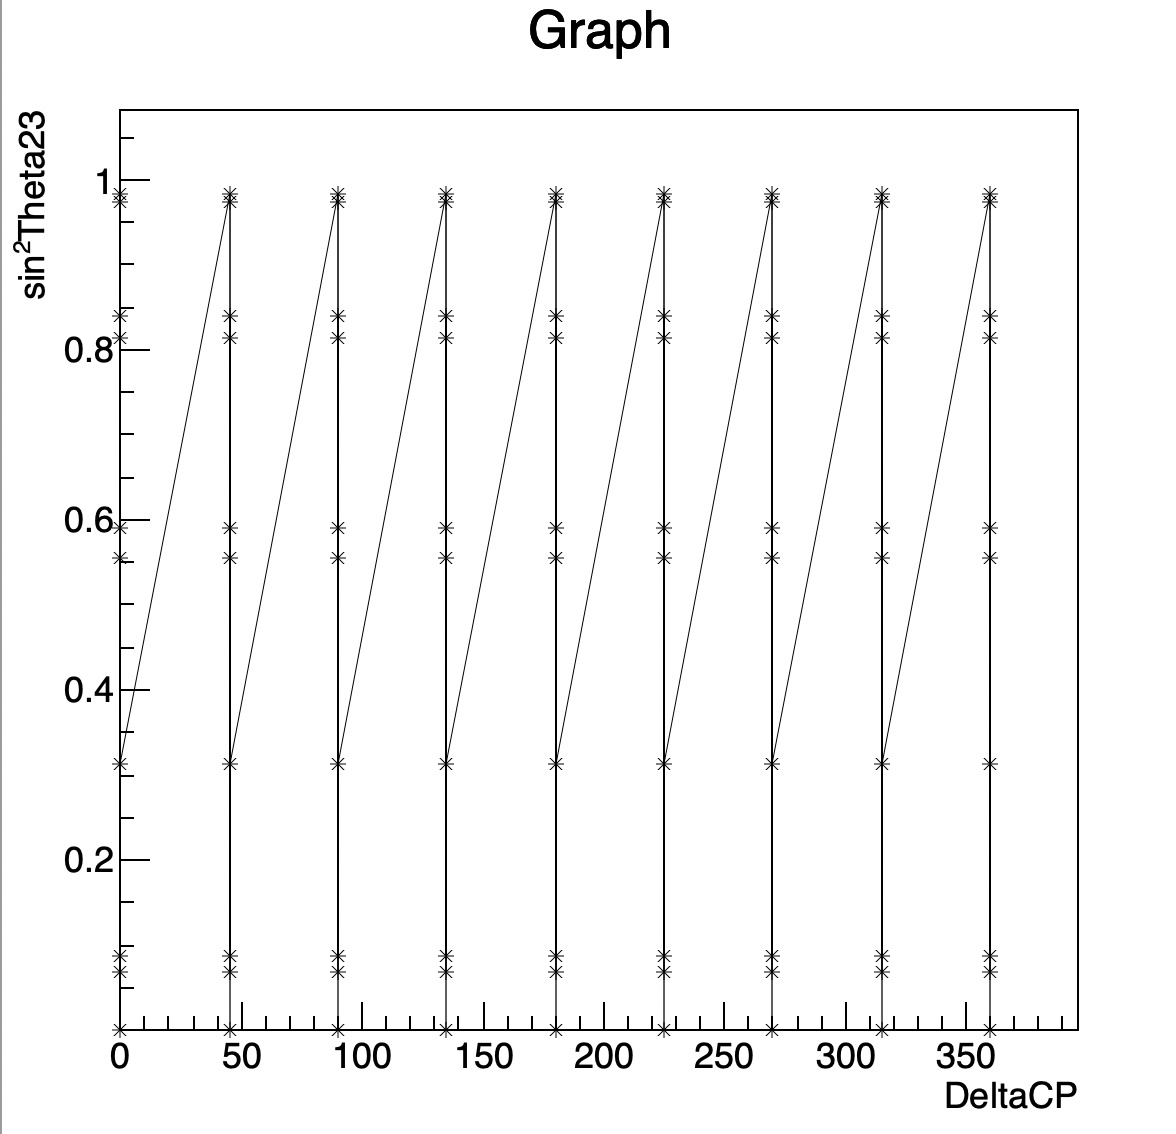
ohhkk… Now, I am trying a graph plot…
By fixing z axis value… a graph between x and y axes.
This is not working… Please see my updated folder
datafiles.tar.gz (1.5 KB)
Thank you.
Yes, exactly I am also getting this. But if we use gnuplot with the script that I have updated in the folder it gives a different picture, I want to use ROOT for plotting this… Contours plots from ROOT.
But look at the points you gave to TGraph … they are aligned on columns … nothing like a contour. As I said TGraph simply link the points by a line. if you want a contour your points should define it properly. I am curious to see the gnuplot script you are using with this data file and the kind of plot you get.
I tried your commands in gnuplot. But it does not work for me.
gnuplot> set contour
gnuplot> set view map
gnuplot> unset surface
gnuplot> set cntrparam discrete levels 2.3,6.2,11.8
                       ^
         expecting 'linear', 'cubicspline', 'bspline', 'points', 'levels' or 'order'

gnuplot> splot "test1.dat" with lines
WARNING: Plotting with an 'unknown' terminal.
No output will be generated. Please select a terminal with 'set terminal'.
gnuplot>
{
  TGraph2D *g1 = new TGraph2D("test1.dat");
  g1->SetNameTitle("g1", "test1;x;y;z");
  TGraph2D *g2 = new TGraph2D("test2.dat");
  g2->SetNameTitle("g2", "test2;x;y;z");
  Double_t c3[3] = {2.3, 6.2, 11.8};
  TCanvas *c = new TCanvas("c", "c", 800, 400);
  c->Divide(2, 1);
  c->cd(1);
  g1->Draw("SURF3"); // e.g. "SURF3" or "CONT5"
  g1->GetHistogram()->SetContour(3, c3);
  c->cd(2);
  g2->Draw("SURF3"); // e.g. "SURF3" or "CONT5"
  g2->GetHistogram()->SetContour(3, c3);
  c->cd(0);
}
Yes or
g->Draw("CONT1");
which gives:
But i am not sure that’s what @srishino wants as he tried tor Draw the contour directly for the dat file … that might suggest that the data in the dat file are defining the contour.
Hi,
This is the plot that I am getting using the script below-
“”
gnuplot> set contour
gnuplot> set view map
gnuplot> unset surface
gnuplot>set cntrparam levels discrete 2.3,6.2,11.8
gnuplot> splot [0:360][0:0.9] “test1.dat” with lines
“”
mygnuplot.pdf (7.7 KB)
These are the details of GNUPLOT version that I am using-
G N U P L O T
Version 4.6 patchlevel 2    last modified 2013-03-14
Build System: Linux x86_64gnuplot> set terminal pdf
have you tried Wile suggestion ?
I just tried this… I am getting the plot attached below-
myRootplot.pdf (117.1 KB)
I want only the red portion as a one-dimensional plot…
Yea its working… Thanks a lot… 