Dear rooters,
I am trying to fit a TH1 (which is the ratio of two histoograms) in a control region in order to extrapolate a correction factor to some yields in a signal region.
I am fitting the ratio of the histograms with an exponenential function. In order to understand the impact of the error on the parameters on the fit function, I am plotting the 68% confidence level on the function using the GetConfidenceInterval function of the TFitter class.
The code is basically readapted from one of the tutorials.
#include "TGraphErrors.h"
#include "TGraph2DErrors.h"
#include "TCanvas.h"
#include "TF2.h"
#include "TH1.h"
#include "TVirtualFitter.h"
#include "TRandom.h"
#include "TFitResultPtr.h"
#include "TMinuit.h"

void ConfidenceIntervals()
{

    //gROOT->SetBatch(1);

    //TVirtualFitter::SetDefaultFitter("Minuit");

    TRandom* random = new TRandom();

    TCanvas *myc = new TCanvas("myc",
      "Confidence intervals on the fitted function",1200, 500);
   myc->Divide(3,1);

    TF1 *f = new TF1("fexp", "[0]*exp(x*[1])", 5300, 10000);
    //TF1 *f = new TF1("fexp", "[0]+[1]*x", 5300, 10000); //This looks reasonable
    f->SetParameters(0.77, -0.00004);

   ////2. A histogram
   myc->cd(2);
   //Create, fill and fit a histogram
   Int_t nh=5000;
   TH1D *h = new TH1D("h",
      "Fitted gaussian with conf.band", 43, 0, 10000);
    h->GetYaxis()->SetRangeUser(0., 2.);
   //h->FillRandom("fgaus", nh);
   for (int i=1; i<44; ++i){
       double value = f->Eval(h->GetBinCenter(i));
       value = value * random->Gaus(1, 0.10);
       if (h->GetBinCenter(i)>5300){
         h->SetBinContent(i, value);
         h->SetBinError(i,0.05);
       }
   }

   f->SetParameters(1., 0);
   f->SetLineWidth(2);
   h->Fit(f, "EV");

   h->Draw();

   //Create a histogram to hold the confidence intervals
   TH1D *hint = new TH1D("hint",
      "Fitted exponential with conf.band", 100, 0, 10000);
   (TVirtualFitter::GetFitter())->GetConfidenceIntervals(hint, 0.68);
   //Now the "hint" histogram has the fitted function values as the
   //bin contents and the confidence intervals as bin errors
   hint->SetStats(kFALSE);
   hint->SetFillColor(2);
   hint->Draw("e3 same");
   h->Draw("same");

    myc->cd(1);


    gMinuit->SetErrorDef(9);
   TGraph *graph3 =(TGraph*) gMinuit->Contour(80, 0,1);
   graph3->SetFillColor(kGreen);
   graph3->Draw("alf");

   gMinuit->SetErrorDef(4);
   TGraph *graph2 =(TGraph*) gMinuit->Contour(80, 0,1);
   graph2->SetFillColor(kYellow);
   graph2->Draw("lf, same");

    gMinuit->SetErrorDef(1);
   TGraph *graph =(TGraph*) gMinuit->Contour(80, 0,1);
   graph->SetMarkerColor(kGreen);
    graph->SetFillColor(kGreen);
    graph->Draw("lf,same");


    //graph->Draw("alf,same");

    return;
}
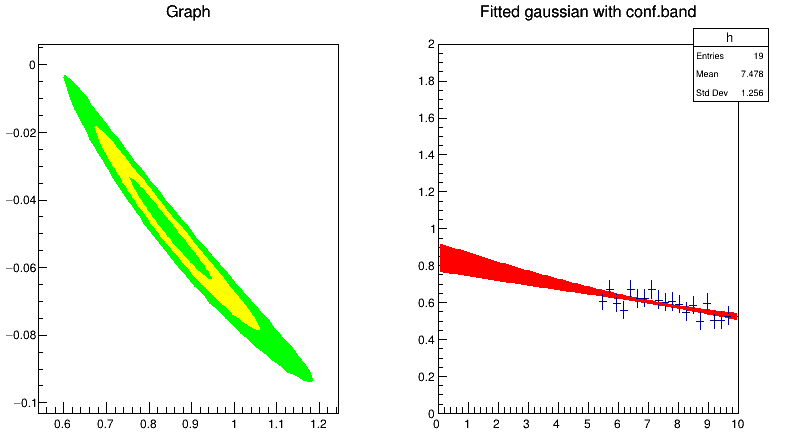
As you see from the following plot, the confidence band just explodes at high x. And what is also surprising is that it explodes where the points are located.
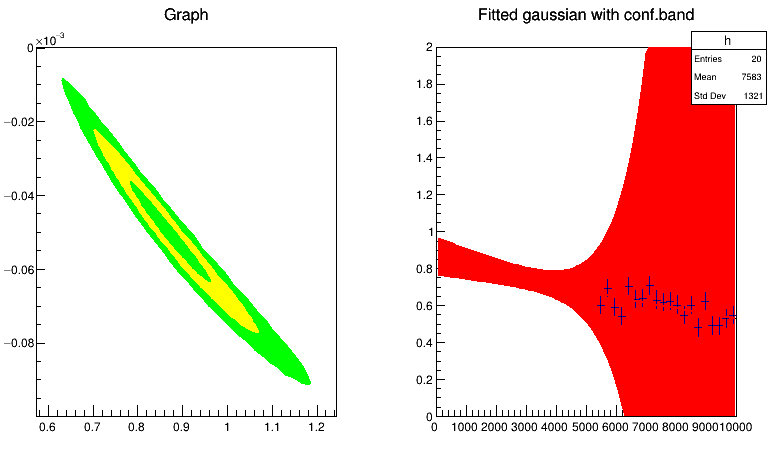
At first I thought it was only a problem of a non so parabolic chi2 around the minimum (the plot on the left). But adding more points, and with a more parabolic chi2, the feature remains.
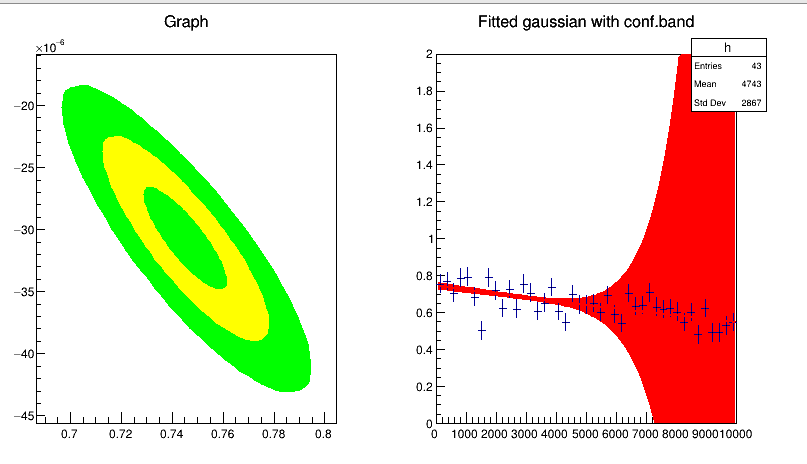
I know that the evaluation of the error band is done using the linear approximation in the error propagation formula. So is what I see only a problem arising from the fact that the function is not linear in the parameters? If I use a linear model, than the error is well behaved, but I would like to fully understand why this is happening with the exponential and why in this strange way.
Thanks a lot for any help
_ROOT Version: 6.14
Platform: Not Provided
Compiler: Not Provided