faca87
June 17, 2023, 5:34pm
1
Hello,
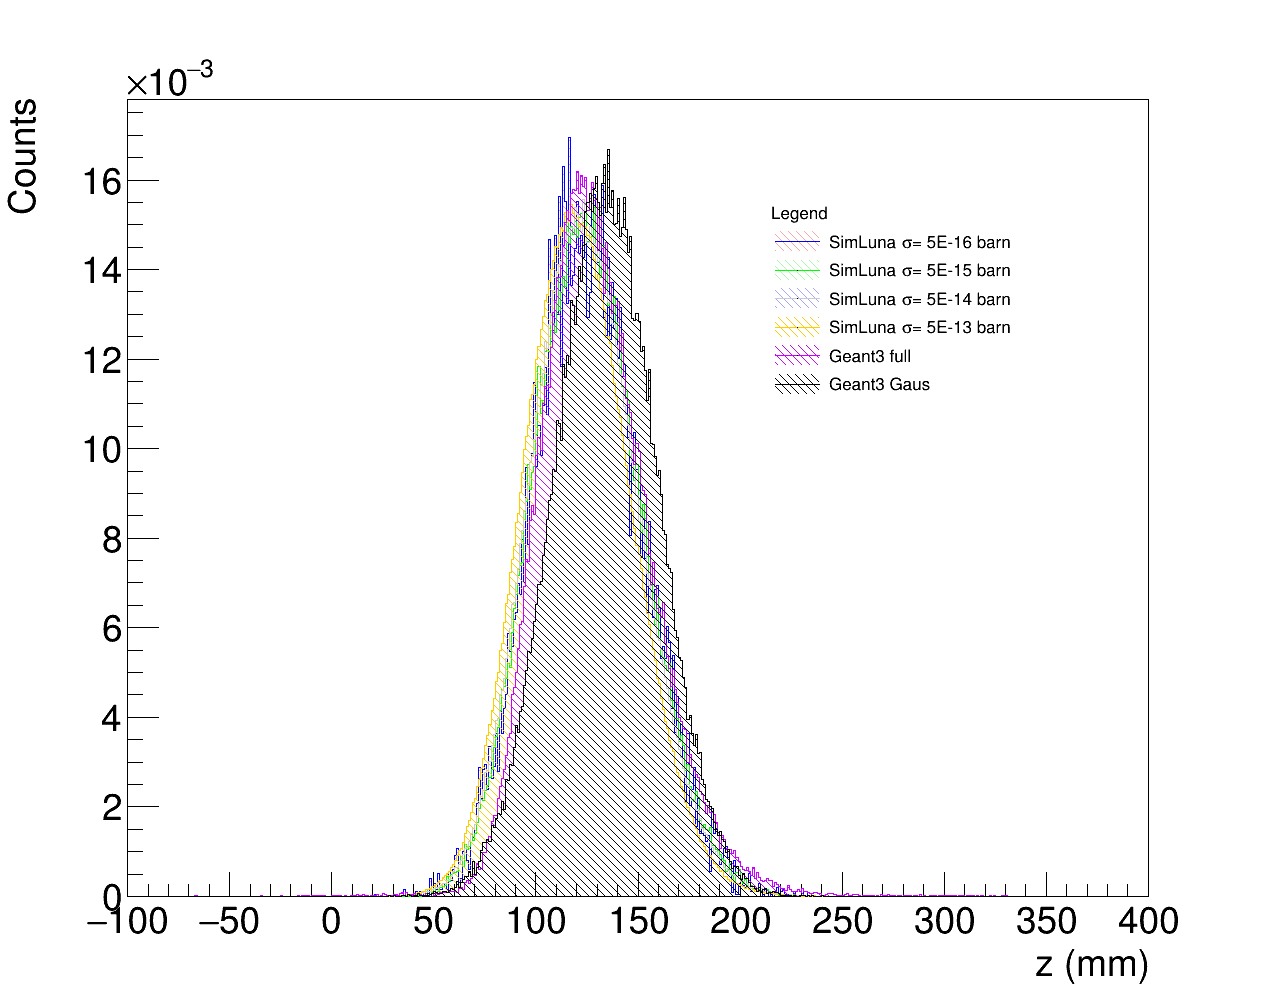
Now I should check the agreement between each one of the GEANT4 distribution with the one called GEANT3 full.
I’m trying to do that by using the Chi2Test() function. I found this example ROOT: tutorials/math/chi2test.C File Reference made by @moneta et al. and I’m trying to write this macro
chi2test.cpp (3.1 KB)
but I’ve some doubts.
According to the documentation, the “P” option should return chi2, ndf, p_value, igood, but I don’t get the p_value, indeed I got
Chi2 = 1739.425216, Prob = 7.91802e-194, NDF = 319, igood = 3
The Chi2 is very high…does it depend on mistakes in the code or is it due to the data?
Even if I get both the residual and qq plots, I get segmentation violation error (See attachment)
nohup.txt (5.4 KB)
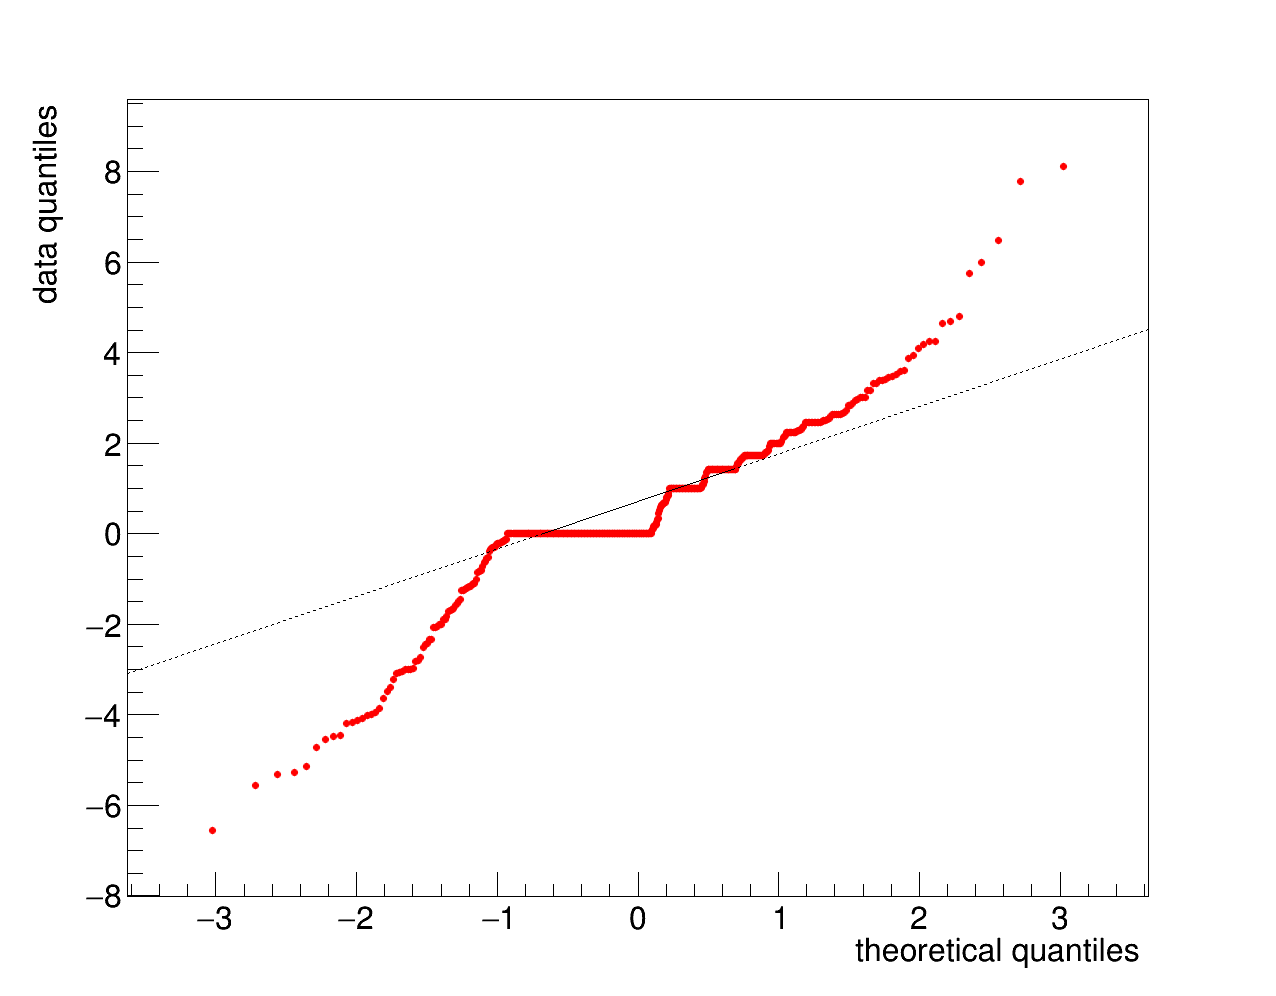
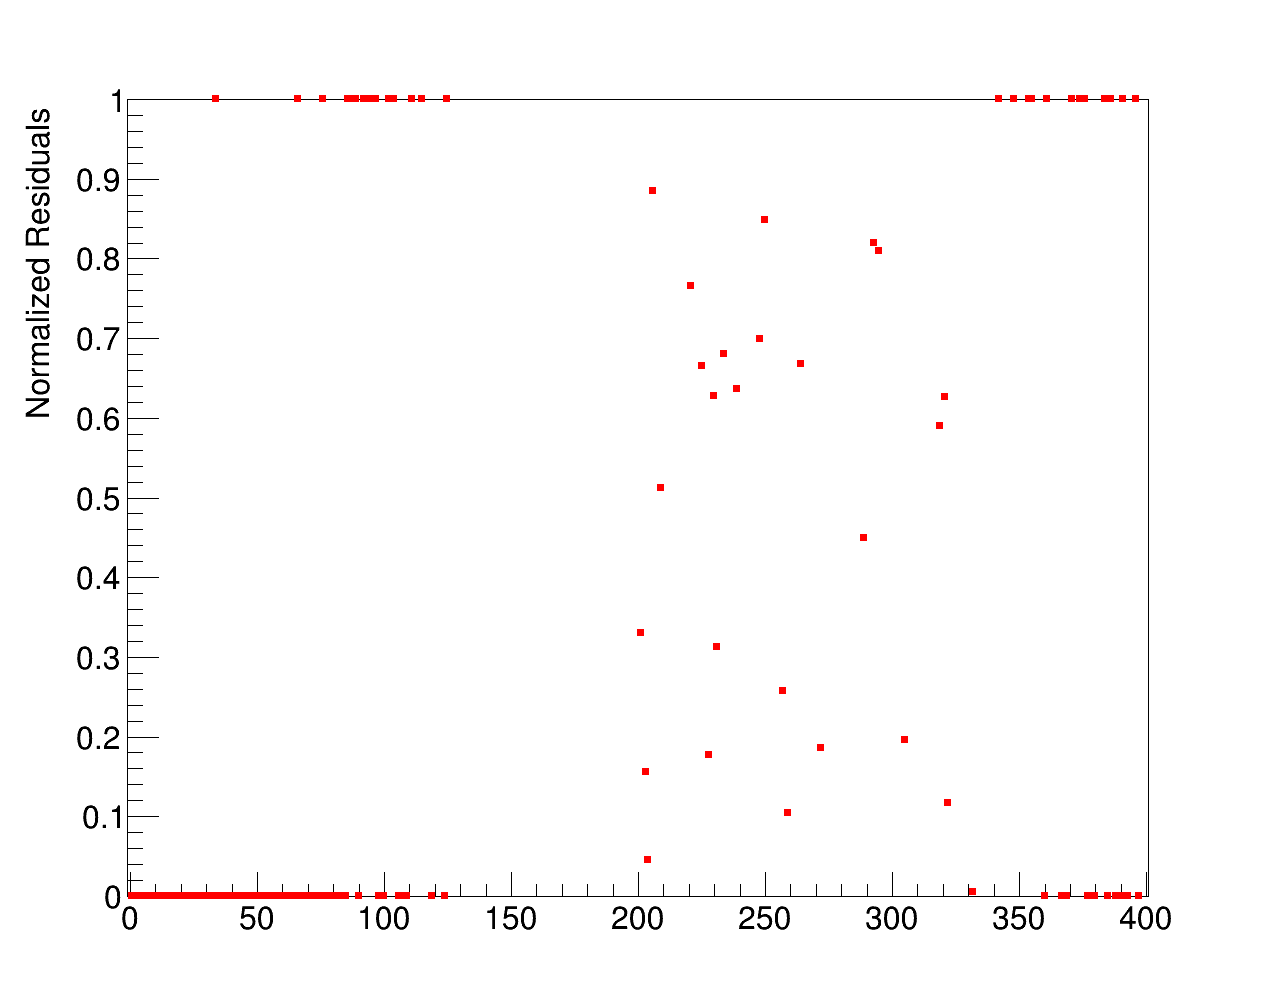
I get these residual and qq plots
but I’m not sure that I wrote the right settings (actually, very likely, I’m not using the right settings).
For example I set n=500 (i.e. bin number) but I’m not sure that n should be the bin number. Moreover, in the ROOT: tutorials/math/chi2test.C File Reference example, the authors set
x[i]= 4.+i*12./20.+12./40.;
but given that I binned htempt1 and htempt2 1bin=1mm, I set
x[i]= i,
PS. If needed here the ROOT files:
moneta
June 26, 2023, 1:03pm
4
Hi,
However, the big chi2 value indicate a big discrepancy of the histograms, and the obtained p-value (Prob) is almost zero.
The crash is probably caused by the fact you are deleting the canvas but not some of the other objects and this confuses ROOT.
Lorenzo
faca87
June 26, 2023, 4:35pm
5
Hi @moneta ,chi2test.cpp (3.2 KB)
but I still get these plots
andChi2 = 1739.425216, Prob = 7.91802e-194, NDF = 319, igood = 3
I uploaded the files again
moneta
June 27, 2023, 8:44am
6
Thank you for the file, Next time, it is easier if you just upload a ROOT file containing the two histograms you would like to compare.
I am not sure what the problem is, the result is what it is given the histogram. You are not correctly plotting the resiual, you can use the corrected code (attached) to visualise them.
Lorenzo
chi2test.cpp (3.1 KB)
faca87
June 27, 2023, 3:01pm
7
Thank you @moneta
moneta
June 27, 2023, 4:46pm
8
Just look at the plot of the two histograms, you see in some regions very big difference that is also shown in the normalised residuals, and that results as well in a very small chi2 probability