I use this code:
const Double_t min = 0;
const Double_t max = 100;
const Int_t nLevels = 5000;
Double_t levels[nLevels];
for (int i = 1; i < nLevels; i++)
    {
        levels[i] = min + (max - min) / (nLevels - 1) * (i);
    }
levels[0] = 0.001;
matrix_c->SetContour((sizeof(levels)/sizeof(Double_t)), levels);
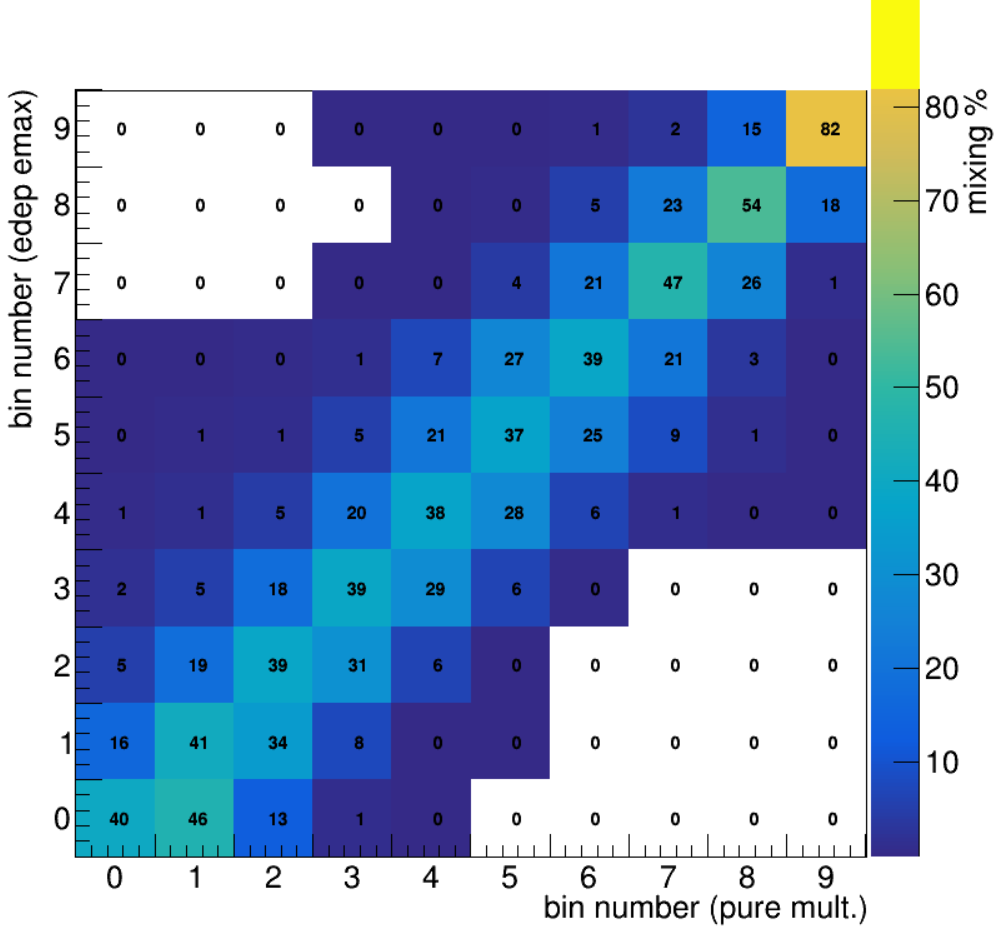
and I get this result:
For what reason does the colour change after 82%? How do I fit the colour palette (although obviously these are related problems)?
linev
2
@Va_Findesiecle
Can you provide minimal running macro that we can reproduce the problem?
I guess, main problem with your macro that min/max values in the Contour exceed max values in the histogram. Could you limit number of levels by 82%?
I need the Z-axis (palette) to be 100%, no matter what the maximum value in the matrix is (the values in the matrix cannot exceed 100).
test_macro_colors.cpp (1.6 KB)
linev
4
Try hist->SetMaximum(100), in this case you do not need custom contour levels
Still not working properly
linev
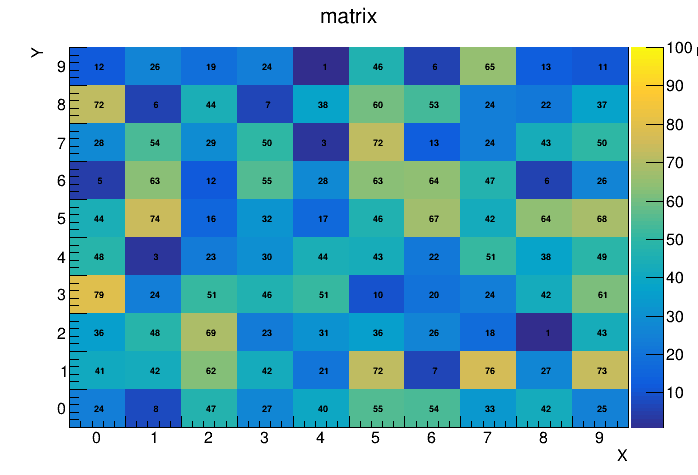
6
If I call matrix->SetMaximum(100) and change max = 100, I got image:
For me looks fine. You also can skip matrix->SetContour() call.
Here modified example: test_macro_colors.cpp (1.6 KB)