Colored 2D histograms in pdf output

Any progress on this?

The problem also occurs on Linux evince.

Even if this is an issue with certain PDF viewers, and not the fault of ROOT, it is still a rather significant problem. Many people who will be reading our publications will be doing it on Preview (or evince). Even if those of us know that we should view these plots in a particular program, we can not expect our readership to. It will look like the person who created the plot was lazy. The particularly bad thing is that some users will create plots, publish them, and never realize that some people will see their plots as ugly.

At the very least, maybe there should be a warning printed to screen when you try to print to ps or pdf using a 2d colored histogram?

No, no progress as it was clear it was an issue with Preview on Mac. Acrobat reader works fine.
The smoothing algorithm is Preview provoques this effect. If you turn it off the lines disappear.
It ls not clear what to do with the current implementation of COL option in PDF. The bins are
just drawn next to each other.

Dear rooters,
I still think it would be very useful to have in ROOT the capability of producing vectorial plots in which the 2D coloured histograms are plain. This is the strategy Matlab seems to follow.
2D col histograms are sometimes very heavy because they contain many bins and each one of those a colour to be rendered.
This fact, in mac Preview, creates the annoying white lines that we have been commenting in this post.
But not only that, I am trying to publish a plot which is too heavy and slow in the pdf viewers exactly because it displays each bin “separately”.
I know that I can make a plain image, but the result is not very satisfactory in professional publications because the lines, labels, etc. don’t scale and thus the result is rather rough.

I really think that the solution would be to have as an option a selective treatment of graphical objects, i.e., create a vectorial image (pdf) where all the objects are scalable (lines, labels, functions, etc.), but the 2D coloured histograms are plain.
This will certainly fix my problem with the journal together with the “ugly” rendering of mac Preview and other pdf viewers.

If not, I am really stuck with my problem, and the only solution that I have is asking to a partner of mine to produce the plot with Matlab.

Thanks a lot!

PS: I am attaching both files in png and pdf respectively.


RakePanel2D-facet_v23kA_19.pdf (1.44 MB)

If your picture is large enough then the scaling will be a Zoom-Out when you will include it in your document and the text and labels will scale nicely. That’s what I am doing and it works nicely. I have never seen a counterexample.

The png picture that I sent as an example has a resolution of 640x1024.
This is the outcome on doubling the resolution (1280x2048):


Clearly, the look is far from the quality in the pdf.

Cheers,
Alberto

This picture does not look that bad …

The “Preview” issue with Pdf is a bug in Preview-Smoothing. Turn of the smoothing in the preferences and the line will disappear.

Remains the problem of size… I can try to look at a way to produce this picture without drawing the boxes individually but:

  1. right now I have no idea how to do this with pdf
  2. this will work for square bins only.

For PostScript I had implemented the CEll Array mechanism to draw the TASImage image in a more compact way. There is no lines when I display with Preview and smoothing on but the color are fading … So even in that case Preview has a bug.

I just went to this whole discussion again. And seems to me we had already explained all the details. So let me summarize:

  1. Preview has a bug with smoothing and produces lines between boxes
  2. Mathlab produces plot without line but it use bitmap not vector graphics
  3. 2D histograms are not bitmaps … we cannot use a bitmap appraoch to render them
  4. if you want to rendre hist as himage see root.cern.ch/root/html534/tutori … age.C.html

Hi Alberto,

By the way I find the picture you produced really nice. Would you allow me to add in the web site ROOT picture gallery ? root.cern.ch/drupal/category/ima … ualization

If yes, what would be the legend ?

Olivier

Oh, thanks!
But I am not allowed to do it in the present moment because it is not published yet.
As soon as it is, it will be my pleasure to share it.
That’s why I am trying to solve this problem, the journal complains about the size of the pdf (which makes the document very glitchy to read) and also doesn’t want png graphics.
That reminds me that I should delete the pictures from this forum up to their publication.

I will try to make an image from the histograms and then make a pdf which has lines, labels, etc like scalable objects and plain images for the histograms. That should be doable following the method you posted earlier, right?

would the publisher accept the attached pdf file ?
Rake5Panel2D-facet_v23kA.G.RI.c.3D_19.pdf (81.1 KB)

But… this is the same than the png, but in pdf format. No scalable features.
Besides, the dotted lines in top panel are continuous.
No way it will be accepted.

Yes it is a png converted into pdf. if you have a part of a pdf file as bitmap (as mathlab does), it will not be scalable either. When you have a PS or PDF file containing a bitmap then the file is not vector graphics anymore.
That’s why for PS and PDF we stay with real drawing … not bitmap. Plus, as I already said, histogram are not bitmap, and the bins are usually bigger that a pixel. Moreover the bins can have any shape like in TH2Poly and in that case a bitmap approach does not work. May be you are mis-using histograms and you should use bitmap instead.
Finally, I do not understand why your publisher does not like the pdf. It is only 1.5 Mb !!! nothing !

BTW have you noticed that your top plot right axis has twice the label “1” ?

The labels and axes and other vector components will be scalable. The TH2 can be nearly perfectly rendered as a bitmap and will scale fine (since boxes scale well, even for bitmaps) as long as interpolation for the image is disabled.

For anyone who wants a way to get a bitmap for the TH2 but vector for the axes etc., I’ve had luck using matplotlib and pythonhosted.org/rootplot/root2matplotlib.html to convert a TH2 into a matplotlib histogram.

There are still a few tricks you need (setting the interpolation to none and telling the colorbar to set_edgecolor(‘face’)) to produce quality pdf’s but at least the tools are there.

EDIT:

Unfortunately, even a bitmap is not safe… preview does not respect the \Interpolate option in an embedded image in a PDF and so will interpolate the bitmap even when it shoudn’t. A solution may be to split the bins into sub-pins so the interpolation does not affect the bulk of a bin.

Another thing I’ve noticed is that the matplotlib colorbar will have lines in it with some viewers unless the faces are set to the same color as the insides (the set_edgecolor(‘face’) option), which suggests that the problem is that some viewers display the box edges even if they are of width 0 and the solution would be to make them the same color as the box.

[quote=“couet”]Hi Alberto,

By the way I find the picture you produced really nice. Would you allow me to add in the web site ROOT picture gallery ? root.cern.ch/drupal/category/ima … ualization

If yes, what would be the legend ?

Olivier[/quote]

Dear Oliver,

Fortunately, we finally published our work in PRL:
http://prl.aps.org/abstract/PRL/v111/i24/e245003

And now it is possible to distribute the figure.
So, if you are still interested, I’d be very happy to contribute to the root’s gallery with this plot.
Thanks for the interest!

Best regards.

Hi Alberto,

Yes please ! I still have your plot on my Desktop :slight_smile: but may be you have a more up to date one ?
And also it would be nice if you give me the appropriate comments going with it. (authors, description etc …)
Thanks in advance.

Olivier

Hello Oliver,

Apologies for the very late reply. I somehow missed your answer during the Christmas season.
Let me please share the latest version of that plot (png):


The pdf version is too large (>2MB) to be sent through this post.
Precisely, this is due to the fact that in the pdf, the colored 2D histograms are vectorial and they take a lot of memory.

Greetings,
Alberto

Many thanks Alberto,
What would be the comment of for the picture ?

One of the best workarounds to avoid the bad-rendering of the pdf is to save your canvas as .tex and then compile it with pdflatex.

E.g.

TCanvas* c = new TCanvas();
TF2 *f2 = new TF2("f2","xygaus + xygaus(5) + xylandau(10)",-4,4,-4,4);
Double_t params[] = {130,-1.4,1.8,1.5,1, 150,2,0.5,-2,0.5, 3600,-2,0.7,-3,0.3};
f2->SetParameters(params);
TH2F h2("h2","xygaus + xygaus(5) + xylandau(10)",100,-4,4,100,-4,4);
h2.FillRandom("f2",1000000);
h2.Draw("COLZ");
c->SaveAs("a.tex");
c->SaveAs("b.pdf");

And then in latex (see https://root.cern.ch/drupal/content/saving-canvas-tex):

\documentclass{article}
\usepackage{tikz}

\begin{document}
\begin{figure}
\begin{center}
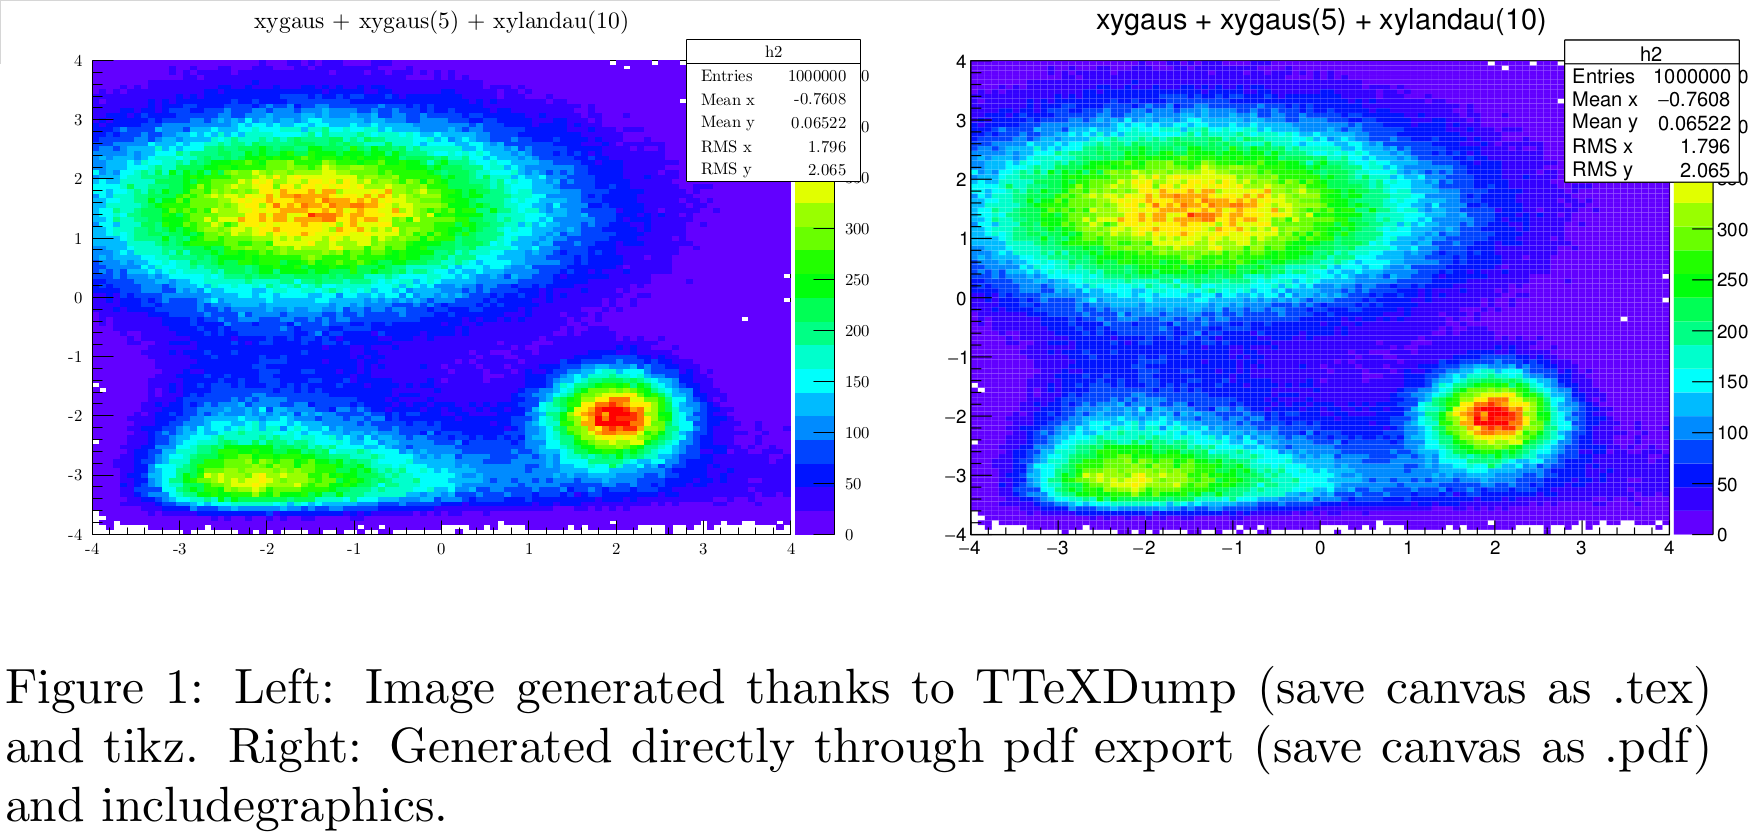
\scalebox{0.31}{\input{a.tex}}\includegraphics[scale=0.31]{b.pdf}
\caption{Left: Image generated thanks to TTeXDump (save canvas as .tex) and tikz. Right: Generated directly through pdf export (save canvas as .pdf) and includegraphics.}
\end{center}
\end{figure}
\end{document}

See attachments for comparing both outputs. The left figure does not suffer from bad rendering and is however not bitmap-based (in contrast to matplotlib).

If you use too many histogram bins, there can be a problem with the pdftex maximum memory capacity.

If you import h2.pdf to inkscape and compare the xml-code of a given rectangle-color bin, you get:

Left (tikz good rendering): fill:#6300ff;fill-opacity:1;fill-rule:nonzero;stroke:#6300ff;stroke-opacity:1;stroke-width:0.3985;stroke-linecap:butt;stroke-linejoin:miter;stroke-miterlimit:10;stroke-dasharray:none
Right (pdf bad rendering) fill:#6300ff;fill-opacity:1;fill-rule:evenodd;stroke:none


h2.pdf (216 KB)

Right (pdf bad rendering)

Seems to me it is good …