Canvas with 2 different plot areas

Hello,

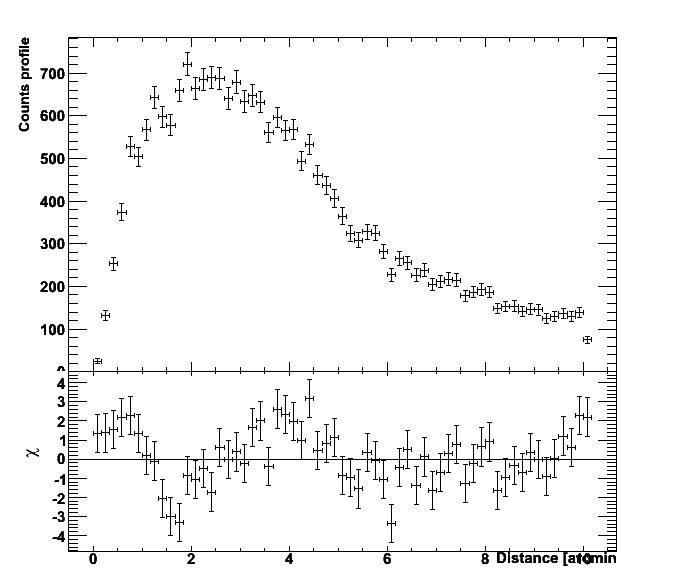
I would like to create a plot with 2 different plot areas, one on top of the other as shown in the attached figure. I would like to have both plots on the same Canvas as two parts of the same plot as shown in the figure, and not as two separate plots as provided by TCanvas::Divide(). Does anyone know how to do that?

Thank you

Dominique

see this example

Rene

[code]void ratio() {
TH1F *h1 = new TH1F(“h1”,“test1”,100,-3,3);
h1->FillRandom(“gaus”,200000);
h1->GetXaxis()->SetLabelFont(63); //font in pixels
h1->GetXaxis()->SetLabelSize(16); //in pixels
h1->GetYaxis()->SetLabelFont(63); //font in pixels
h1->GetYaxis()->SetLabelSize(16); //in pixels
TH1F *h2 = new TH1F(“h2”,“test2”,100,-3,3);
h2->FillRandom(“gaus”,100000);
TCanvas *c1 = new TCanvas(“c1”,“example”,600,700);
TPad *pad1 = new TPad(“pad1”,“pad1”,0,0.3,1,1);
pad1->SetBottomMargin(0);
pad1->Draw();
pad1->cd();
h1->DrawCopy();
h2->Draw(“same”);
c1->cd();
TPad *pad2 = new TPad(“pad2”,“pad2”,0,0,1,0.3);
pad2->SetTopMargin(0);
pad2->Draw();
pad2->cd();
h1->Sumw2();
h1->SetStats(0);
h1->Divide(h2);
h1->SetMarkerStyle(21);
h1->Draw(“ep”);
c1->cd();
}

[/code]

Thanks a lot Rene, it works fine.

And also, thank you for all the great work developping ROOT.

Dominique

Dear Rene,

It works fine, but I have yet another problem (see attached): the bottom distance between the X axis and the bottom of the Canvas is too small, and therefore the axis name is not readable. How do I change that?

I’ve tried:

h1->GetXaxis()->SetTitleOffset(2.5)

This works, but then the title is partly below the bottom of the canvas.

Thanks a lot

Dominique


Modify the bottom margin of the bottom pad. See my previous script with some changes.

Rene

[code]void ratio() {
TH1F *h1 = new TH1F(“h1”,“test1”,100,-3,3);
h1->FillRandom(“gaus”,200000);
h1->GetXaxis()->SetLabelFont(63); //font in pixels
h1->GetXaxis()->SetLabelSize(16); //in pixels
h1->GetYaxis()->SetLabelFont(63); //font in pixels
h1->GetYaxis()->SetLabelSize(16); //in pixels
TH1F *h2 = new TH1F(“h2”,“test2”,100,-3,3);
h2->FillRandom(“gaus”,100000);
TCanvas *c1 = new TCanvas(“c1”,“example”,600,700);
TPad *pad1 = new TPad(“pad1”,“pad1”,0,0.3,1,1);
pad1->SetBottomMargin(0);
pad1->Draw();
pad1->cd();
h1->DrawCopy();
h2->Draw(“same”);
c1->cd();
TPad *pad2 = new TPad(“pad2”,“pad2”,0,0,1,0.3);
pad2->SetBottomMargin(0.25);
pad2->SetTopMargin(0);
pad2->Draw();
pad2->cd();
h1->Sumw2();
h1->SetStats(0);
h1->Divide(h2);
h1->SetMarkerStyle(21);
h1->GetXaxis()->SetTitle(“distance in mm”);
h1->GetXaxis()->SetTitleOffset(2.9);
h1->GetXaxis()->SetTitleFont(73);
h1->GetXaxis()->SetTitleSize(14);
h1->Draw(“ep”);
c1->cd();
}

[/code]