Can't Seem to Get Transparency to Work

Hello,

I’m having trouble getting any sort of transparencies to work on a graph I’m trying to make. I’d like to have the three lines have a semi-transparent error band around them but I only can seem to get completely opaque or completely transparent fills. I’ve tried the SetFillColorAlpha, SetFillStyle(“4050”), and other methods and have had no luck.

Oddly enough, when I download the pdf, it works. It seems just the root window is broken. I’d rather not have to download the graph every time I run a piece of code to see if it works, however.
transparent.pdf (14.5 KB)

ROOT Version: 6.22/03
Platform: Ubuntu 20.04.2 LTS

Maybe you miss something like: gStyle->SetCanvasPreferGL(kTRUE);

See also the “Color transparency” entry in the TAttFill class description.

I’ve read through the TAttFill class description several times and wasn’t able to get any of its suggestions to work. Below is the code I’m using for plotting, which just plots a handful of vectors that are passed to the function this is inside:

gStyle->SetCanvasPreferGL(kTRUE);
	TGraphErrors* ex = new TGraphErrors(gPoints,&intervalList[0],&expect[0],&xErr[0],&expectErr[0]); 							ex->SetLineColor(kRed);		ex->SetLineWidth(3); ex->SetFillStyle(4080); ex->SetFillColorAlpha(kRed,0.4);
	TGraphErrors* me = new TGraphErrors(gPoints,&intervalList[0],&measure[0],&xErr[0],&measureErr[0]); 							me->SetLineColor(kGreen);	me->SetLineWidth(3); me->SetFillStyle(4080); me->SetFillColorAlpha(kGreen,0.4);
	TGraphErrors* ef = new TGraphErrors(intervalEfficiency.size(),&effXAxis[0],&intervalEfficiency[0],&effXErr[0],&effErr[0]);	ef->SetLineColor(kOrange);	ef->SetLineWidth(3); ef->SetFillStyle(4080); ef->SetFillColorAlpha(kOrange,0.4);
	ex->SetTitle("Expected");
	me->SetTitle("Measured");
	ef->SetTitle("Measured Efficiency");

	TMultiGraph *mg = new TMultiGraph();
	mg->Add(ex, "LP3");
	mg->Add(me, "LP3");
	mg->Add(ex, "LP");
	mg->Add(me, "LP");
	mg->GetXaxis()->SetTitle("Interval Size (Radians)");
	mg->GetYaxis()->SetTitle("Hits Within their Interval");


	TCanvas *c = new TCanvas("c", "Efficiency", 200, 10, 700, 500);
	TPad *p1 = new TPad("p1", "", 0, 0, 1, 1);
	p1->SetGrid();
	TPad *p2 = new TPad("p2", "", 0, 0, 1, 1);
	p2->SetFillStyle(4000); // will be transparent
	TPad *p3 = new TPad("p2", "", 0, 0, 1, 1);
	p3->SetFillStyle(4000); // will be transparent

	p1->Draw();
	p1->cd();
	mg->Draw("AL");
	gPad->Update();

	Double_t xmin = mg->GetHistogram()->GetXaxis()->GetXmin();
	Double_t xmax = mg->GetHistogram()->GetXaxis()->GetXmax();
	Double_t ymin = ef->GetHistogram()->GetYaxis()->GetXmin();
	Double_t ymax = ef->GetHistogram()->GetYaxis()->GetXmax();
	Double_t dx2 = (xmax - xmin) / 0.8; // 10 percent margins left and right
	Double_t dy2 = (ymax - ymin) / 0.8; // 10 percent margins top and bottom

	Double_t dx3 = (xmax/TMath::Pi() - xmin/TMath::Pi()) / 0.8; // 10 percent margins left and right
	Double_t dy3 = (ymax - ymin) / 0.8; // 10 percent margins top and bottom


	p2->Range(xmin-0.1*dx2, ymin-0.1*dy2, xmax+0.1*dx2, ymax+0.1*dy2);
	p3->Range(xmin/TMath::Pi()-0.1*dx3, ymin-0.1*dy3, xmax/TMath::Pi()+0.1*dx3, ymax+0.1*dy3);
	p2->Draw();
	p2->cd();
	ef->Draw("LP3");
	ef->Draw("LP");
	gPad->Update();
	  
	TGaxis *yaxis = new TGaxis(xmax, ymin, xmax, ymax, ymin, ymax, 510, "+L");
	yaxis->SetLineColor(kBlack);
	yaxis->SetLabelColor(mg->GetXaxis()->GetLabelColor());
	yaxis->SetLabelFont(mg->GetXaxis()->GetLabelFont());
	yaxis->SetLabelSize(mg->GetXaxis()->GetLabelSize());
	yaxis->SetTitleSize(mg->GetXaxis()->GetTitleSize());
	yaxis->SetTitleFont(mg->GetXaxis()->GetTitleFont());
	yaxis->SetTitle("Efficiency");
	yaxis->Draw();
	gPad->Update();

	p3->Draw("");
	p3->cd();

	// TGaxis *xaxis = new TGaxis(xmin/TMath::Pi(), ymax, xmax/TMath::Pi(), ymax, xmin/TMath::Pi(), xmax/TMath::Pi(), 510, "-L");
	// xaxis->SetLineColor(kBlack);
	// xaxis->SetLabelColor(mg->GetXaxis()->GetLabelColor());
	// xaxis->SetLabelFont(mg->GetXaxis()->GetLabelFont());
	// xaxis->SetLabelSize(mg->GetXaxis()->GetLabelSize());
	// xaxis->SetTitleSize(mg->GetXaxis()->GetTitleSize());
	// xaxis->SetTitleFont(mg->GetXaxis()->GetTitleFont());
	// xaxis->SetTitle("Cone Angle (#pi radians)");
	// xaxis->Draw();
	// gPad->Update();

	// p1->cd();
	TLegend *leg = new TLegend(0.0,0.42,0.2,0.58);
	leg->SetFillColor(0);
	leg->SetTextSize(0.036);
	leg->AddEntry(ex, " Expected", "L");
	leg->AddEntry(me, " Measured", "L");
	leg->AddEntry(ef, " Efficiency", "L");
	leg->Draw();
	gPad->Update();

Thanks for your help!

Try:

ex->SetFillStyle(1001);
me->SetFillStyle(1001);
ef->SetFillStyle(1001);

Now everything just becomes opaque:

Post a (minimal) complete macro which we could try.

void effPlotTrial ()
{
	int gPoints = 5;
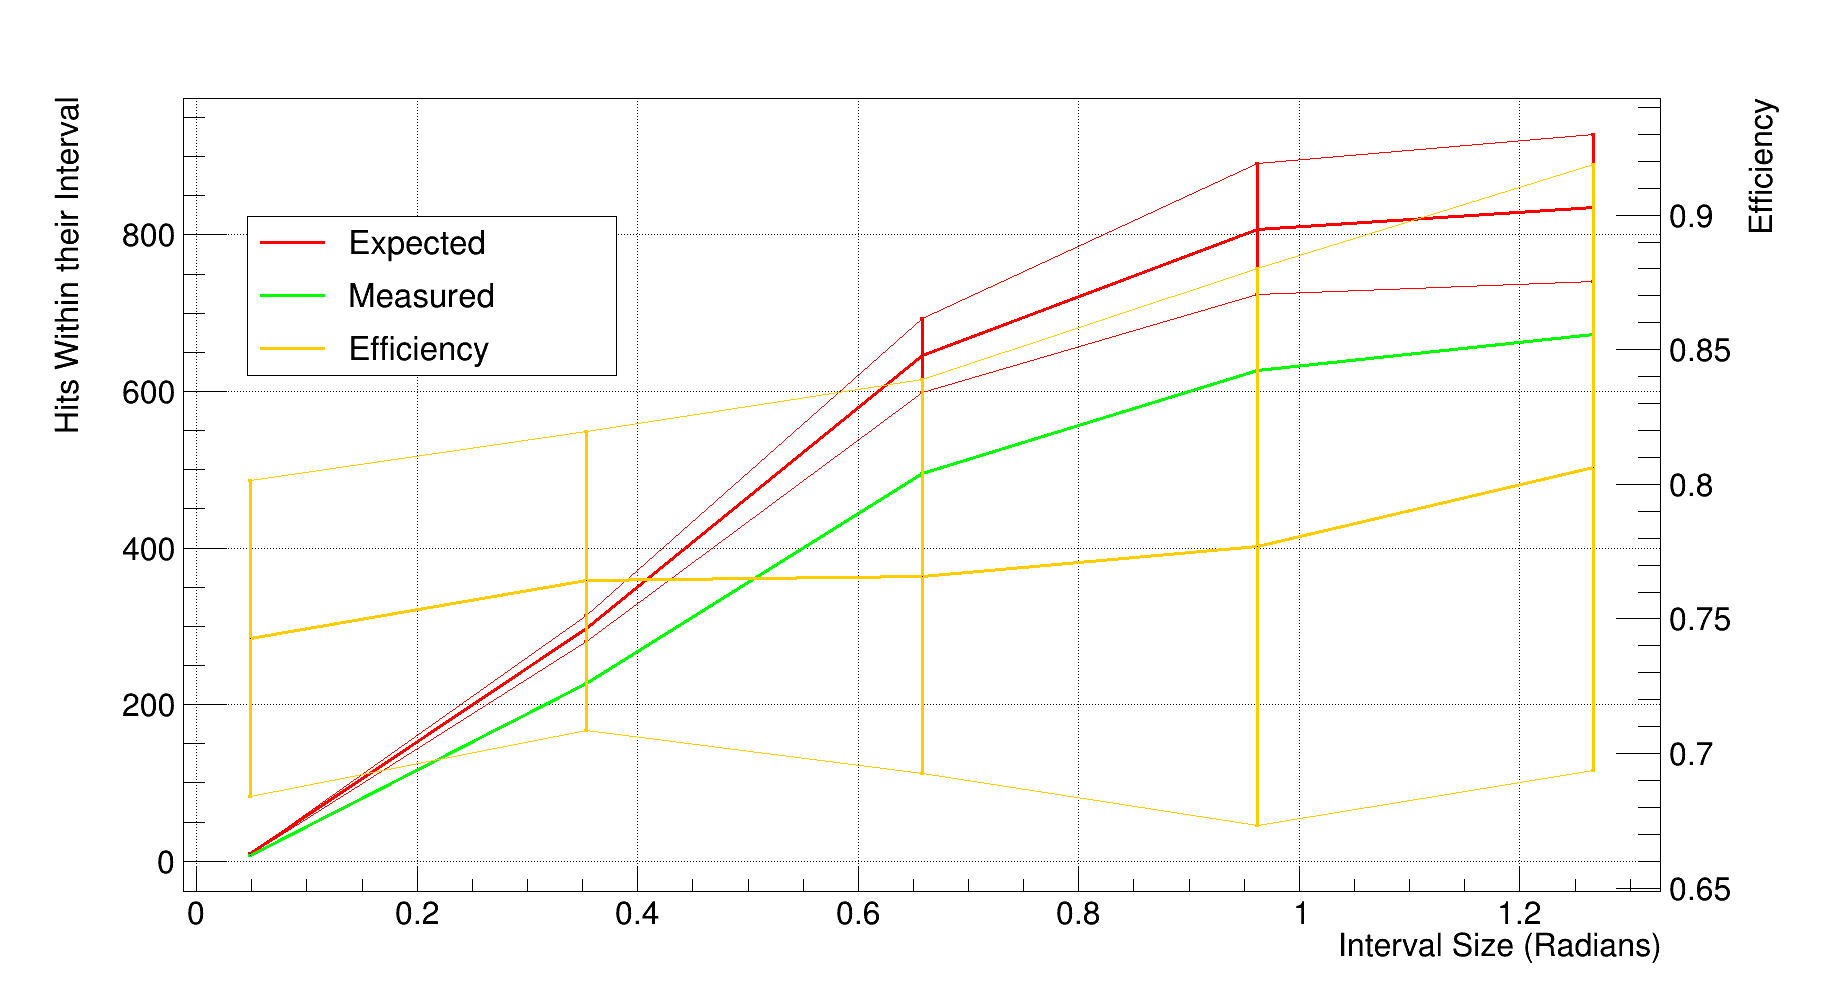
	vector<double> intervalList = {0.0490874, 0.353429, 0.657771, 0.962113, 1.26645};
	vector<double> expect = {9.42361, 297.053, 646.438, 807.199, 834.648};
	vector<double> measure = {7, 227, 495, 627, 673};
	vector<double> intervalEfficiency = {0.742815, 0.764172, 0.765735, 0.776761, 0.806328};
	vector<double> effXAxis = {0.0490874, 0.353429, 0.657771, 0.962113, 1.26645};
	vector<double> expectErr = {0.553101, 16.523  , 47.2045 , 83.5811 , 93.9199};
	vector<double> measureErr = {0.00263647, 0.00789316, 0.0175327 , 0.0264338 , 0.0339007 };
	vector<double> effErr = {0.0586943, 0.0556231, 0.0730225, 0.103545, 0.112526};

	vector<double> xErr, effXErr;

	for (int i = 0; i < gPoints; ++i)
	{
		xErr.push_back(0);
	}

	for (int i = 0; i < intervalEfficiency.size(); ++i)
	{
		effXErr.push_back(0);
	}

	gStyle->SetCanvasPreferGL(kTRUE);
	TGraphErrors* ex = new TGraphErrors(gPoints,&intervalList[0],&expect[0],&xErr[0],&expectErr[0]); 							ex->SetLineColor(kRed);		ex->SetLineWidth(3); ex->SetFillStyle(1001); ex->SetFillColorAlpha(kRed,0.4);
	TGraphErrors* me = new TGraphErrors(gPoints,&intervalList[0],&measure[0],&xErr[0],&measureErr[0]); 							me->SetLineColor(kGreen);	me->SetLineWidth(3); me->SetFillStyle(1001); me->SetFillColorAlpha(kGreen,0.4);
	TGraphErrors* ef = new TGraphErrors(intervalEfficiency.size(),&effXAxis[0],&intervalEfficiency[0],&effXErr[0],&effErr[0]);	ef->SetLineColor(kOrange);	ef->SetLineWidth(3); ef->SetFillStyle(1001); ef->SetFillColorAlpha(kOrange,0.4);
	ex->SetTitle("Expected");
	me->SetTitle("Measured");
	ef->SetTitle("Measured Efficiency");

	TMultiGraph *mg = new TMultiGraph();
	mg->Add(ex, "LP3");
	mg->Add(me, "LP3");
	mg->Add(ex, "LP");
	mg->Add(me, "LP");
	mg->GetXaxis()->SetTitle("Interval Size (Radians)");
	mg->GetYaxis()->SetTitle("Hits Within their Interval");


	TCanvas *c = new TCanvas("c", "Efficiency", 200, 10, 700, 500);
	TPad *p1 = new TPad("p1", "", 0, 0, 1, 1);
	p1->SetGrid();
	TPad *p2 = new TPad("p2", "", 0, 0, 1, 1);
	p2->SetFillStyle(4000); // will be transparent
	TPad *p3 = new TPad("p2", "", 0, 0, 1, 1);
	p3->SetFillStyle(4000); // will be transparent

	p1->Draw();
	p1->cd();
	mg->Draw("AL");
	gPad->Update();

	Double_t xmin = mg->GetHistogram()->GetXaxis()->GetXmin();
	Double_t xmax = mg->GetHistogram()->GetXaxis()->GetXmax();
	Double_t ymin = ef->GetHistogram()->GetYaxis()->GetXmin();
	Double_t ymax = ef->GetHistogram()->GetYaxis()->GetXmax();
	Double_t dx2 = (xmax - xmin) / 0.8; // 10 percent margins left and right
	Double_t dy2 = (ymax - ymin) / 0.8; // 10 percent margins top and bottom

	Double_t dx3 = (xmax/TMath::Pi() - xmin/TMath::Pi()) / 0.8; // 10 percent margins left and right
	Double_t dy3 = (ymax - ymin) / 0.8; // 10 percent margins top and bottom


	p2->Range(xmin-0.1*dx2, ymin-0.1*dy2, xmax+0.1*dx2, ymax+0.1*dy2);
	p3->Range(xmin/TMath::Pi()-0.1*dx3, ymin-0.1*dy3, xmax/TMath::Pi()+0.1*dx3, ymax+0.1*dy3);
	p2->Draw();
	p2->cd();
	ef->Draw("LP3");
	ef->Draw("LP");
	gPad->Update();
	  
	TGaxis *yaxis = new TGaxis(xmax, ymin, xmax, ymax, ymin, ymax, 510, "+L");
	yaxis->SetLineColor(kBlack);
	yaxis->SetLabelColor(mg->GetXaxis()->GetLabelColor());
	yaxis->SetLabelFont(mg->GetXaxis()->GetLabelFont());
	yaxis->SetLabelSize(mg->GetXaxis()->GetLabelSize());
	yaxis->SetTitleSize(mg->GetXaxis()->GetTitleSize());
	yaxis->SetTitleFont(mg->GetXaxis()->GetTitleFont());
	yaxis->SetTitle("Efficiency");
	yaxis->Draw();
	gPad->Update();

	p3->Draw("");
	p3->cd();

	TLegend *leg = new TLegend(0.0,0.42,0.2,0.58);
	leg->SetFillColor(0);
	leg->SetTextSize(0.036);
	leg->AddEntry(ex, " Expected", "L");
	leg->AddEntry(me, " Measured", "L");
	leg->AddEntry(ef, " Efficiency", "L");
	leg->Draw();
	gPad->Update();

	return;
}

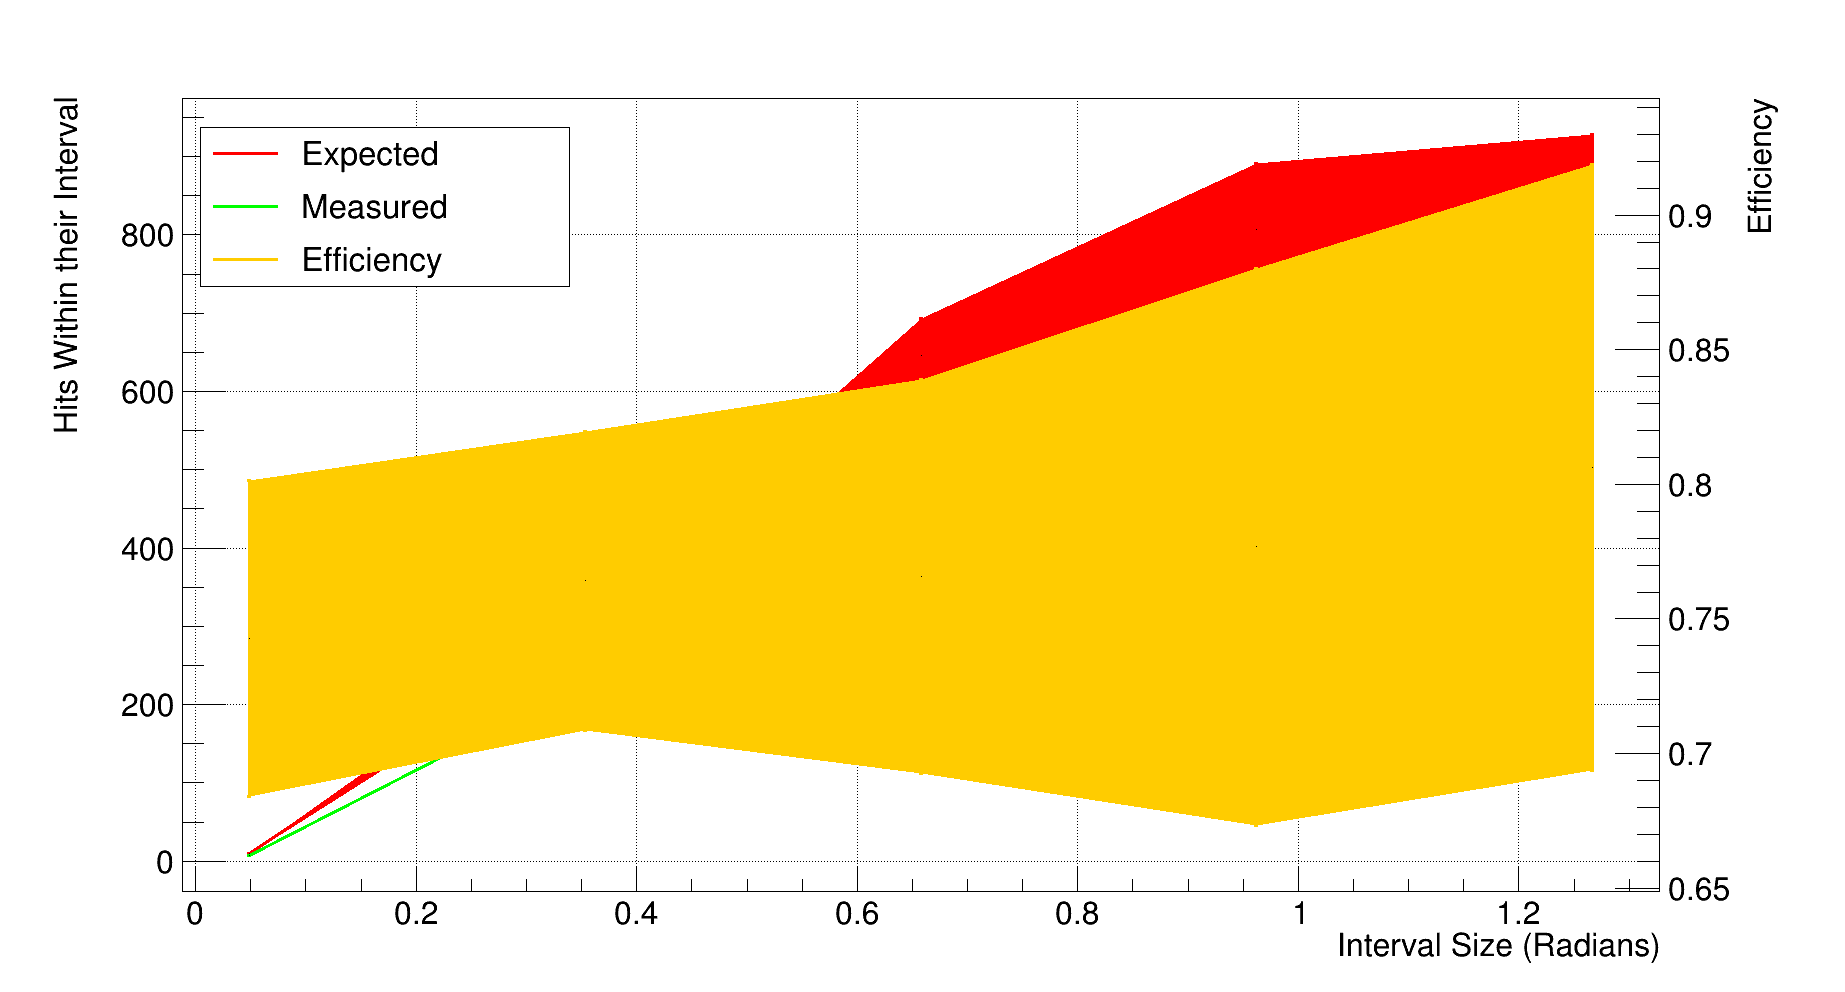
I’m also now getting these errors:

cling::DynamicLibraryManager::loadLibrary(): libGLEW.so.2.0: cannot open shared object file: No such file or directory
Error in <TInterpreter::TCling::AutoLoad>: failure loading library libRGL.so for TX11GLManager
cling::DynamicLibraryManager::loadLibrary(): libGLEW.so.2.0: cannot open shared object file: No such file or directory
Error in <TInterpreter::TCling::AutoLoad>: failure loading library libRGL.so for TGLHistPainter
cling::DynamicLibraryManager::loadLibrary(): libGLEW.so.2.0: cannot open shared object file: No such file or directory

So perhaps it’s a library issue?

Your macro seems o.k. (both, on screen and saved as a “.pdf” file).
c.pdf (14.4 KB)

About the missing library … try: sudo apt-get install libglew

I’ve tried that and get E: Unable to locate package libglew

Apparently libglew (found as libglew2.1) is not really needed, as I don’t have it installed on my Xubuntu 20.04 and the figure looks OK. On an almost clean install, libopengl0 (zero) does the trick, so try sudo apt install libopengl0
Edit: btw, installing libglew2.1 instead of libopengl0 does not solve the issue.

Maybe (it will install several “development” packages which might be useful if you try to compile / build ROOT later): sudo apt-get install libglew-dev

Hi,

Sorry for the late reply, but I am still having trouble with either completely transparent or completely opaque errors in the figures after installing the mentioned libraries above via apt install. I am still getting the error:

Error in <TInterpreter::TCling::AutoLoad>: failure loading library libRGL.so for TX11GLManager
cling::DynamicLibraryManager::loadLibrary(): libGLEW.so.2.0: cannot open shared object file: No such file or directory
Error in <TInterpreter::TCling::AutoLoad>: failure loading library libRGL.so for TGLHistPainter
cling::DynamicLibraryManager::loadLibrary(): libGLEW.so.2.0: cannot open shared object file: No such file or directory

Thanks for your help,

Liam

Ubuntu 20.04.2 LTS provides “libGLEW.so.2.1”.

It seems that you are trying to use some ROOT binary distribution that is not compatible with your system.

Try (note: binary releases provided by the ROOT Team use “builtin_glew”): ROOT 6.24/02

Hi, reinstalling and rebuilding root worked! Thank you!

This topic was automatically closed 14 days after the last reply. New replies are no longer allowed.