Cannot voxelize Top :less than 2 boundaries on X

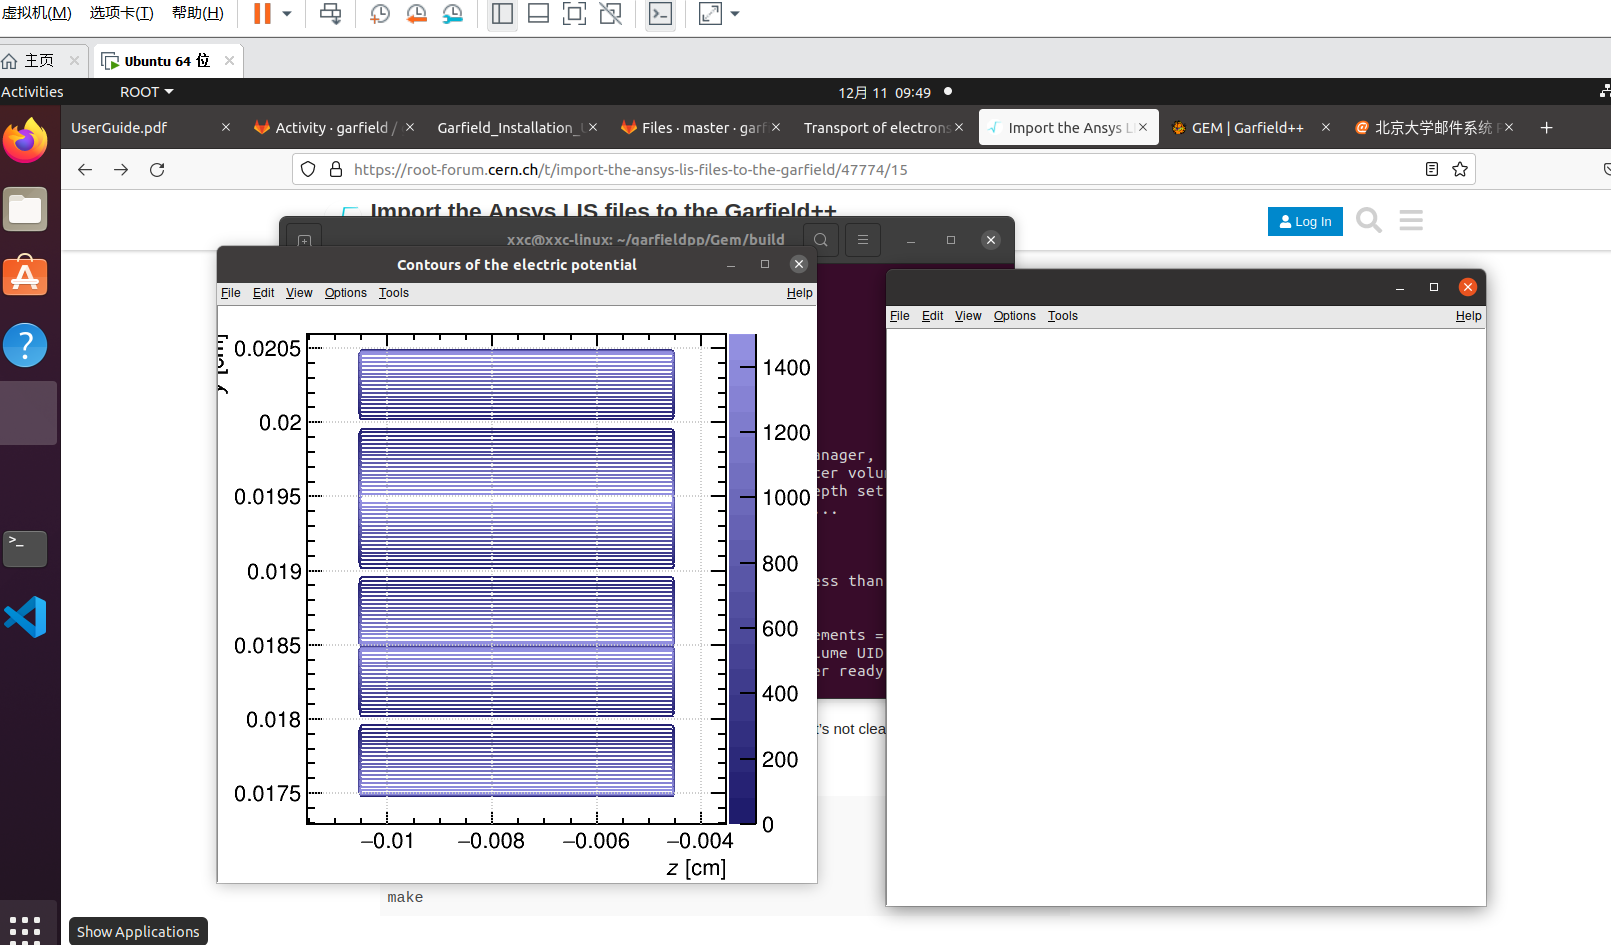
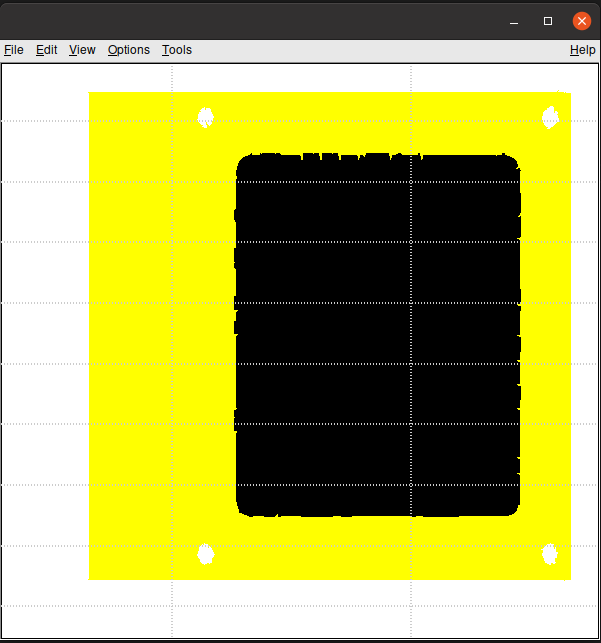
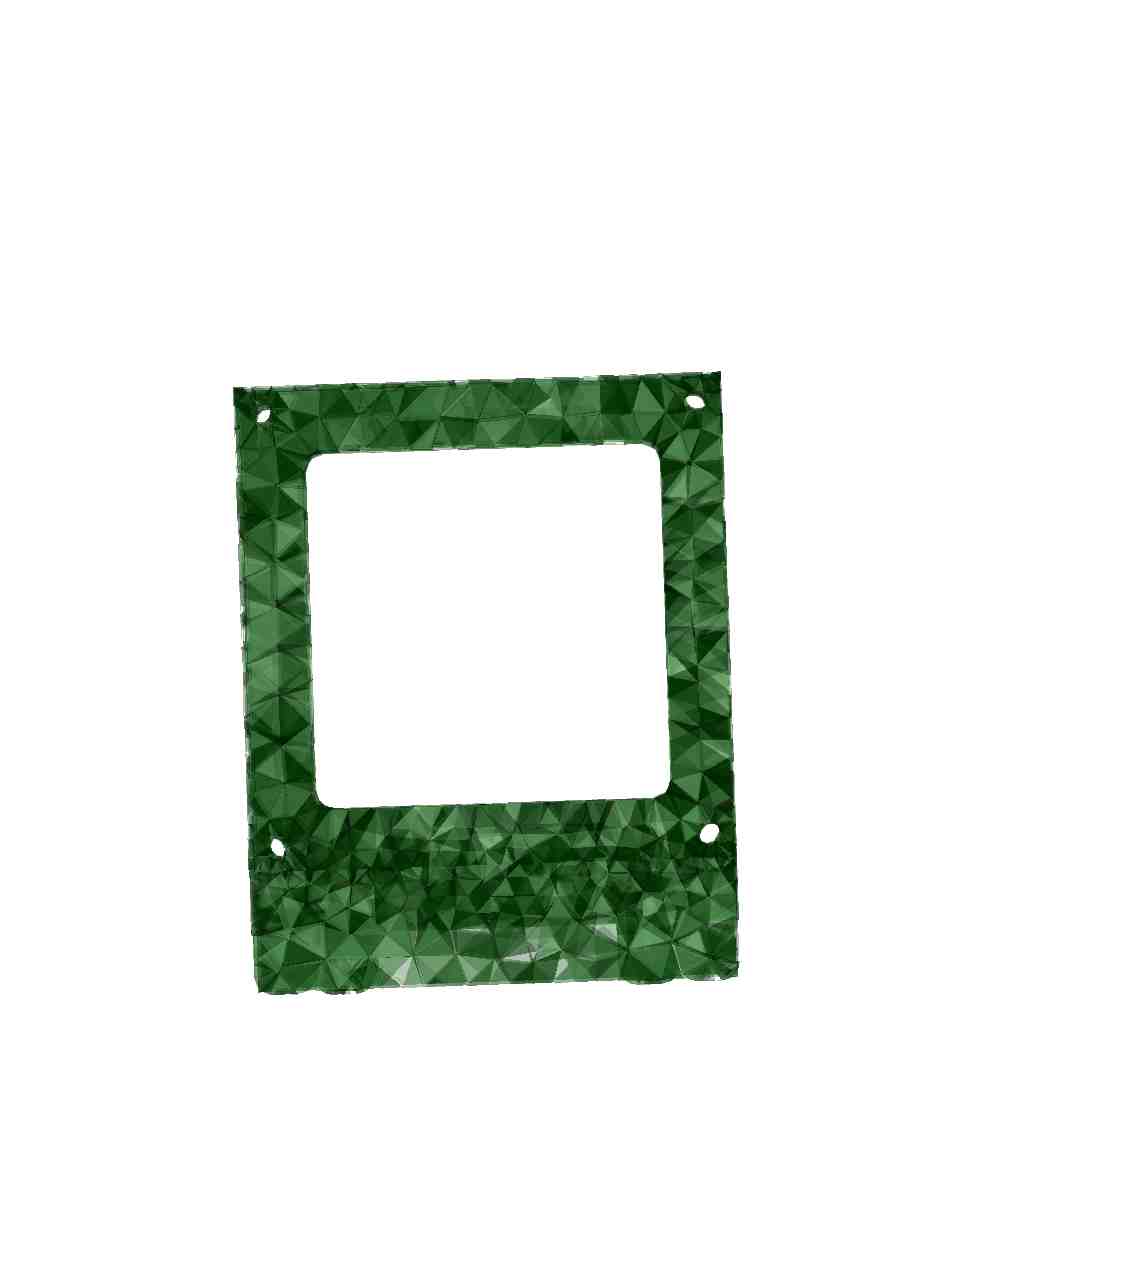
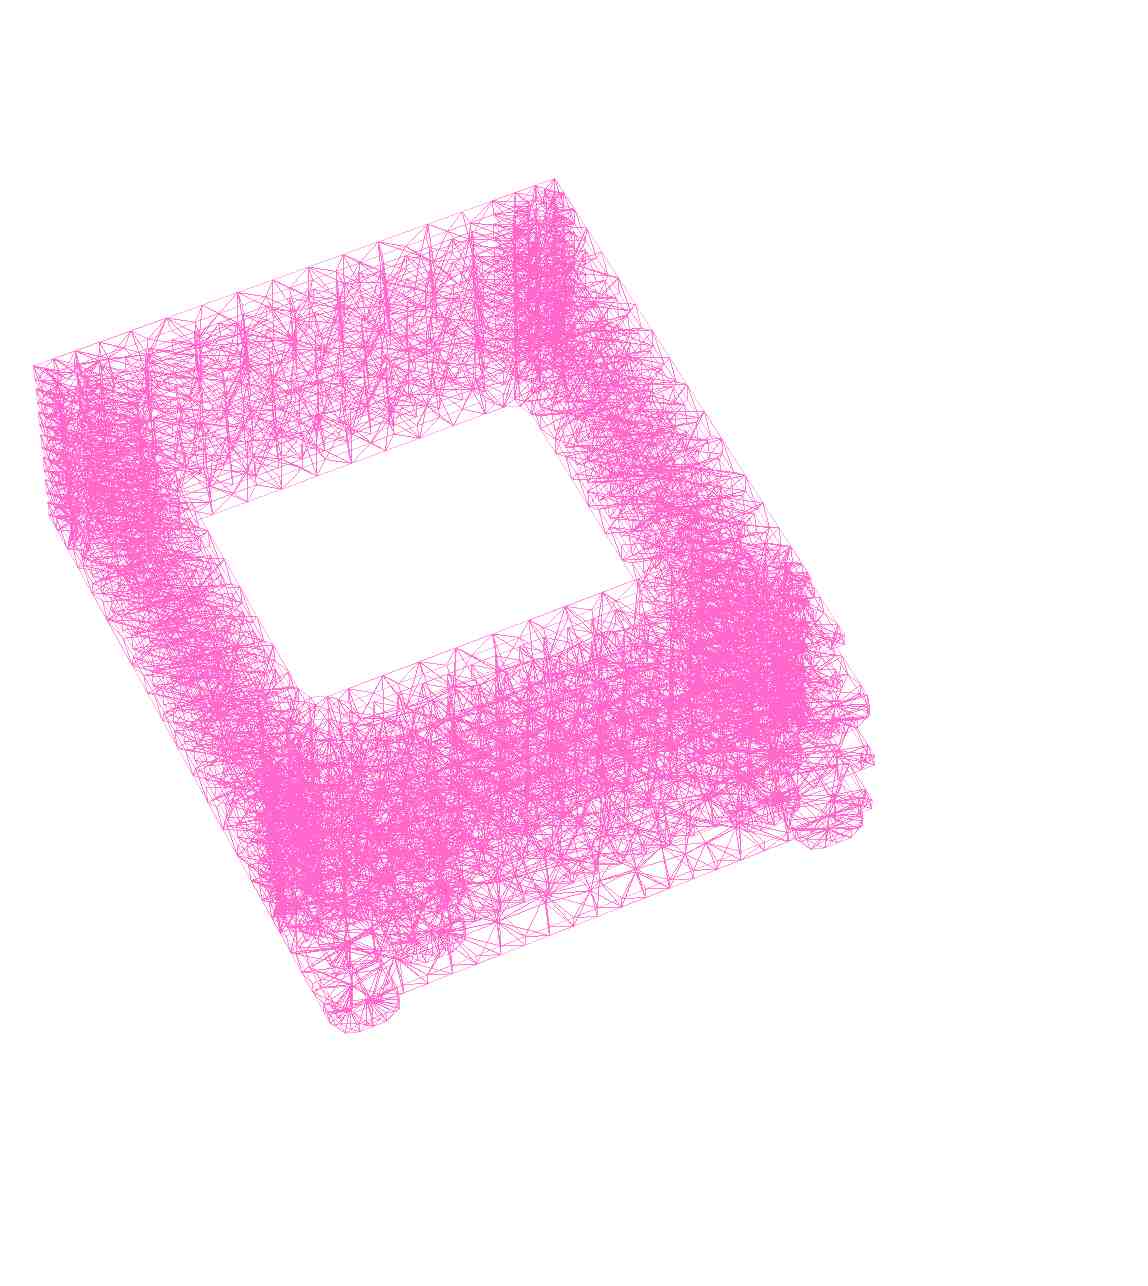
When I import the Ansys model to the Garfield++, the results show in the below. but the contour plot is empty. the error notice that" Cannot voxelize Top :less than 2 boundaries on X"

mponentAnsys123::Initialise:
    Read 2235639 elements from file ELIST.lis,
    highest node number: 3236513,
    background elements skipped: 0
ComponentAnsys123::Initialise:
    Read 3236513 nodes from file NLIST.lis.
ComponentAnsys123::Initialise:
    Read 3236513 potentials from file PRNSOL.lis.
ComponentAnsys123::Prepare:
    Caching the bounding boxes of all elements... done.
ComponentAnsys123::InitializeTetrahedralTree: Success.
ComponentAnsys123::PrintRange:
        Dimensions of the elementary block
                 -0.0167044 < x < -0.00670436     cm,
                  0.0172927 < y < 0.0205927       cm,
                 -0.0115321 < z < -0.00353211     cm,
                          0 < V < 1500            V.
        Periodicities
            x: none
            y: none
            z: none
Info in <TGeoManager::TGeoManager>: Geometry ViewFEMeshGeoManager,  created
Info in <TGeoManager::SetTopVolume>: Top volume is Top. Master volume is Top
Info in <TGeoNavigator::BuildCache>: --- Maximum geometry depth set to 100
Info in <TGeoManager::CheckGeometry>: Fixing runtime shapes...
Info in <TGeoManager::CheckGeometry>: ...Nothing to fix
Info in <TGeoManager::CloseGeometry>: Counting nodes...
Info in <TGeoManager::Voxelize>: Voxelizing...
Error in <TGeoVoxelFinder::SortAll>: Cannot voxelize Top :less than 2 boundaries on X
Info in <TGeoManager::CloseGeometry>: Building cache...
Info in <TGeoManager::CountLevels>: max level = 1, max placements = 13134
Info in <TGeoManager::CloseGeometry>: 13135 nodes/ 13135 volume UID's in 
Info in <TGeoManager::CloseGeometry>: ----------------modeler ready----------------
Info in <TGeoManager::SetMaxVisNodes>: Automatic visible depth for 13136 visible nodes


You’ll find attached a simple program to make a contour plot of the electrostatic potential and the plot that I get using it.

contours.pdf (206.5 KB)
test.C (796 Bytes)

PS: are you sure that “mm” is the right unit for your field map?

Sorry for missing your reply, Thanks a lot for helping me, the files are really helpful. my actual model’s size is mm, so I can chose the mm unit, I will think whether the unit is right in the Garfield++ . thanks a lot for your help again.
now the mesh view is still empty,but the field view is ok


ComponentAnsys123::Initialise:
Read properties of 2 materials from file MPLIST.lis.
ComponentAnsys123::Initialise:
Read 2159067 elements from file ELIST.lis,
highest node number: 3124105,
background elements skipped: 0
ComponentAnsys123::Initialise:
Read 3124105 nodes from file NLIST.lis.
ComponentAnsys123::Initialise:
Read 3124105 potentials from file PRNSOL.lis.
ComponentAnsys123::Prepare:
Caching the bounding boxes of all elements… done.
ComponentAnsys123::InitializeTetrahedralTree: Success.
ComponentAnsys123::PrintRange:
Dimensions of the elementary block
-0.0167044 < x < -0.00670436 cm,
0.0172927 < y < 0.0205927 cm,
-0.0115321 < z < -0.00353211 cm,
0 < V < 1500 V.
Periodicities
x: none
y: none
z: none
Info in TGeoManager::TGeoManager: Geometry ViewFEMeshGeoManager, created
Info in TGeoManager::SetTopVolume: Top volume is Top. Master volume is Top
Info in TGeoNavigator::BuildCache: — Maximum geometry depth set to 100
Info in TGeoManager::CheckGeometry: Fixing runtime shapes…
Info in TGeoManager::CheckGeometry: …Nothing to fix
Info in TGeoManager::CloseGeometry: Counting nodes…
Info in TGeoManager::Voxelize: Voxelizing…
Error in TGeoVoxelFinder::SortAll: Cannot voxelize Top :less than 2 boundaries on X
Info in TGeoManager::CloseGeometry: Building cache…
Info in TGeoManager::CountLevels: max level = 1, max placements = 10437
Info in TGeoManager::CloseGeometry: 10438 nodes/ 10438 volume UID’s in
Info in TGeoManager::CloseGeometry: ----------------modeler ready----------------

Hi,
I have got the 2D model plot, that’s shown in the below, and it is a little bit strange, the plot seems too coarse. and how can I change the black color to some other color?
my code is"
meshview.setcolor( 1, kyellow);
meshview.setcolor( 2, kpink +6);

Thanks a lot for helping me, although these are trivial problem, but it seems hard to me, and these may spend me several days to solve. So without your help, I can’t proceed so fast. Thanks again.

Hi,
I just forget to say, I still want to get the three dimensional model plot, and I really don’t know why it is still empty, would you please tell me?

Hi,
I want to try the private member function ,but the errors notice that this is a private member function,and used in a wrong way. would you please tell me how to use these private member functions especially the DrawElements 3d() function?
image

Apologies for my late reply.

The empty 3D mesh plot was due to a bug in the ViewFEMesh class. Sorry for that (it’s a feature that was introduced only quite recently). It should be fixed now:

Can you update to the HEAD version of the master branch (git pull), re-build the project (re-run make; make install) and try again?

After updating, you should be able to get a plot like the one attached with these lines of code:

ViewFEMesh meshView;
meshView.SetComponent(&fm);
meshView.SetColor(1, kGreen + 2);
meshView.Plot(false)

In the canvas, click on “View” → “View With” → “OpenGL”.


1 Like
ViewFEMesh meshView;
meshView.SetComponent(&fm);
meshView.SetFillMeshWithBorders();
meshView.SetPlane(0, -1, 0, 0., 0.5 * (y0 + y1), 0.);
meshView.SetColor(0, kPink + 6);
meshView.SetColor(1, kYellow);
meshView.Plot();
1 Like

Hi,
Wow, Thanks a lot for helping me to solve the problem. Now I have updated to the HEAD version of the master branch (git pull ), re-builded the project (re-run make; make install ) and tried again. And it works. However there are something confused me.


The 3D model plot seems vague, I can’t distinguish neither the model shape nor the number of them.
And it just can rotate around a axis, and can’t move as I wish, when I amplify the second plot, it just disappeared,I need to zoom in on a clear picture.
Would you please help me again? Thanks a lot.

You can find some information about the GL viewer here:
https://root.cern.ch/root/htmldoc/guides/users-guide/ROOTUsersGuide.html#the-gl-viewer

The reason the plot looks somewhat fuzzy is that the shapes are drawn filled, with 70% transparency. Unfortunately the transparency setting is hard-coded in ViewFEMesh at the moment (Source/ViewFEMesh.cc ¡ master ¡ garfield / garfieldpp, if you want to change it). I should add a function to make it configurable.

Maybe try to draw the mesh as a wireframe (type ‘w’ after opening the GL viewer)…

1 Like

This topic was automatically closed 14 days after the last reply. New replies are no longer allowed.