Cannot fit graph

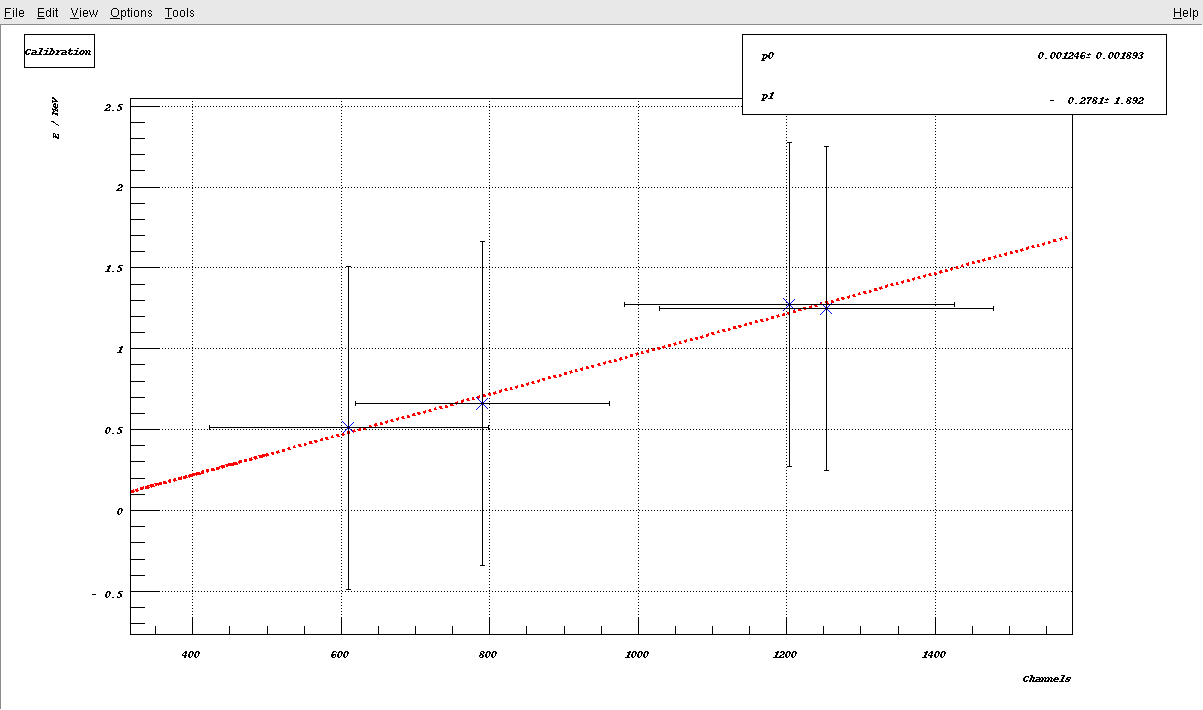
Hi, I have four data points and I would like to fit them but it does not work. Can you please have a look at it?

The code:

int Calibration()
{
	const int points=4;
	double channel[points]={610, 790, 1204, 1254};
	double energy[points]={0.511, 0.6617, 1.274, 1.2491};

	double energy_err[points]={0.0,0.0,0.0,0.0};
	double channel_err[points]={188, 171, 222, 225};

	gROOT->Reset();
	TCanvas* c=new TCanvas("Calibration","Calibration",1700,1000);
	gROOT->SetStyle("Plain");
	gStyle->SetOptStat(0); 
	gStyle->SetOptFit(11);
  	gStyle->SetPadGridX(kTRUE);
  	gStyle->SetPadGridY(kTRUE);
	c->Divide(1,1);
	c->cd(1);

	graph=new TGraphErrors(points, channel, energy, channel_err, energy_err);
	graph->GetXaxis()->SetTitle("Channels");
	graph->GetYaxis()->SetTitle("E / MeV");
	graph->SetMarkerSize(2);
	graph->SetMarkerColor(kBlue);	 
	graph->SetMarkerStyle(20);
	graph->SetTitle("Calibration");
	//graph->GetXaxis()->SetRangeUser(391.5, 395);
	//graph->GetYaxis()->SetRangeUser(140, 170);
	//graph->GetXaxis()->SetNdivisions(5000,kTRUE);

		TF1 *fit = new TF1("fit","([0]*x + [1])", 0, 1500); 

		fit->SetLineColor(kRed);
		fit->SetLineStyle(2);

		graph->Fit(fit);

	graph->Draw("A*");
	fit->Draw("SAME");

	return 0;
}

Thank you in advance!

The problem is that you are setting the error on the energy to zero, and that leads to divisions by zero.
If you set the errors to 1.0, for example, you will get something like this:

1 Like

Mh, but in the following I have that too:

int intensity()
{
	const int points=11;
	double depth[points]={12, 13, 14, 15, 16, 17, 18, 19, 20, 21, 22};
	double intensity[points]={1980, 2141, 2209, 2276, 2504, 2537, 2700, 2858, 2925, 3097, 3258};

	double depth_err[points]={0.0, 0.0, 0.0, 0.0, 0.0, 0.0, 0.0, 0.0, 0.0, 0.0, 0.0};
	double intensity_err[points]={288.0, 361.0, 291.4, 285.67, 302.4, 299.0, 310.35, 319.5, 319.65, 332.0, 343.3};

	gROOT->Reset();
	TCanvas* c=new TCanvas("Intensity", "Intensity", 1700, 1000);
	gROOT->SetStyle("Plain");
	gStyle->SetOptStat(0); 
	// gStyle->SetOptFit(1);
	gStyle->SetOptFit(11);
  	gStyle->SetPadGridX(kTRUE);
  	gStyle->SetPadGridY(kTRUE);
	c->Divide(1,1);
	c->cd(1);

	graph=new TGraphErrors(points, depth, intensity, depth_err, intensity_err);
	graph->GetXaxis()->SetTitle("Depth / mm");
	graph->GetYaxis()->SetTitle("Intensity / ch");
	graph->SetMarkerSize(3);
	graph->SetMarkerColor(kBlue);	 
	graph->SetMarkerStyle(33);
	graph->SetTitle("Intensity");


		TF1 *fit = new TF1("fit","([0]*x + [1])", 11, 23); 

		fit->SetLineColor(kRed);
		fit->SetLineStyle(2);

		graph->Fit(fit);

	graph->Draw("APL");
	fit->Draw("SAME");

	return 0;

And this is fittable(?).

What’s you problem?
I get (I just needed to remove “gROOT->Reset();” and correct the line "TGraphErrors *graph = new TGraphErrors(…);):

 FCN=0.157281 FROM MIGRAD    STATUS=CONVERGED      33 CALLS          34 TOTAL
                     EDM=2.84881e-21    STRATEGY= 1      ERROR MATRIX ACCURATE 
  EXT PARAMETER                                   STEP         FIRST   
  NO.   NAME      VALUE            ERROR          SIZE      DERIVATIVE 
   1  p0           1.24911e+02   3.04275e+01   2.88924e-03   1.20562e-11
   2  p1           4.63049e+02   5.19468e+02   4.93194e-02   7.63963e-13

BTW. In ROOT, before you try to fit your graph or histogram, you MUST set “reasonable” initial values for ALL parameters of your function (except for some “built-in” formulas, like “gaus”, for which the standard fit procedure can automatically “guess” them), otherwise the fitting procedure may easily misbehave.

1 Like

What’s you problem?

Apparently I have to use errors where none should be. The Y axis is the energy of decay modes and I assume even possible error bars are very low?

I removed Reset, corrected the line but I get the same values.
What did you do?
What are reasonable initial values?
I think p0 should something like 0.0005 and p1 something like 0.0?!

When I fit I get

FCN=0.106151 FROM MIGRAD    STATUS=CONVERGED      46 CALLS          47 TOTAL
                    EDM=3.13997e-08    STRATEGY= 1      ERROR MATRIX ACCURATE 
EXT PARAMETER                                   STEP         FIRST   
NO.   NAME      VALUE            ERROR          SIZE      DERIVATIVE 
1  p0           1.26811e-03   4.81496e-04   6.84453e-08  -1.16129e+00
2  p1          -3.01134e-01   4.55035e-01   6.47159e-05  -1.61342e-03

I didn’t set any initial values (I left them “uninitialized”, so both are 0.0).
I tried your macro with ROOT “v5-34-00-patches” and “6.10/08” and in both cases I get the “correct” result.

How do you know they are correct?

This is a damn simple “straight line”.

Selection_229

It seems that we are talking about different macros …
I tried the last one that you posted, i.e. the “intensity”.
You seem to be talking about the first one that you posted, i.e. “Calibration”. In this macro, use:

graph->Fit(fit, "WQN"); // "initial pre-fit"
graph->Fit(fit); // "final fit"
1 Like

:smiley:

Thanks, that’s working! What does “WQN” do?

Check out the documentation: TGraph::Fit.

1 Like

This topic was automatically closed 14 days after the last reply. New replies are no longer allowed.