I can not stylize my histograms after I plot them, here is a before and after output when I try to plot 2 histograms in the same canvas.
Before:
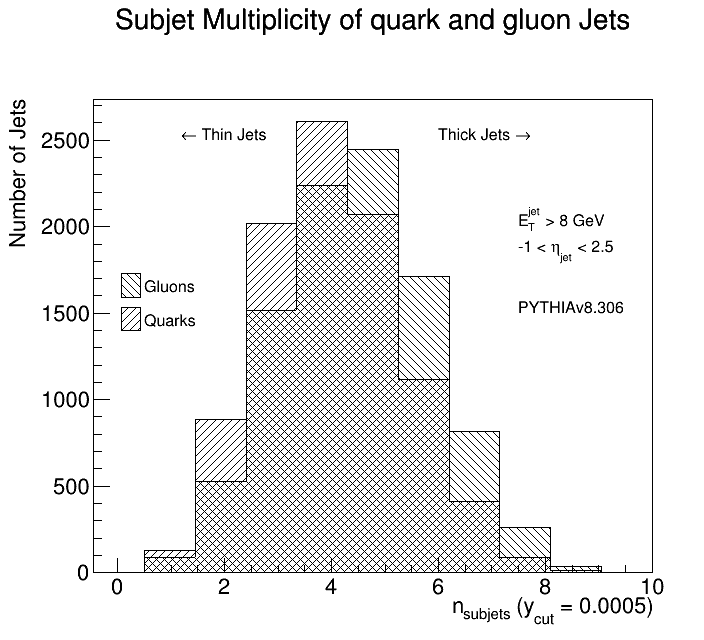
After:
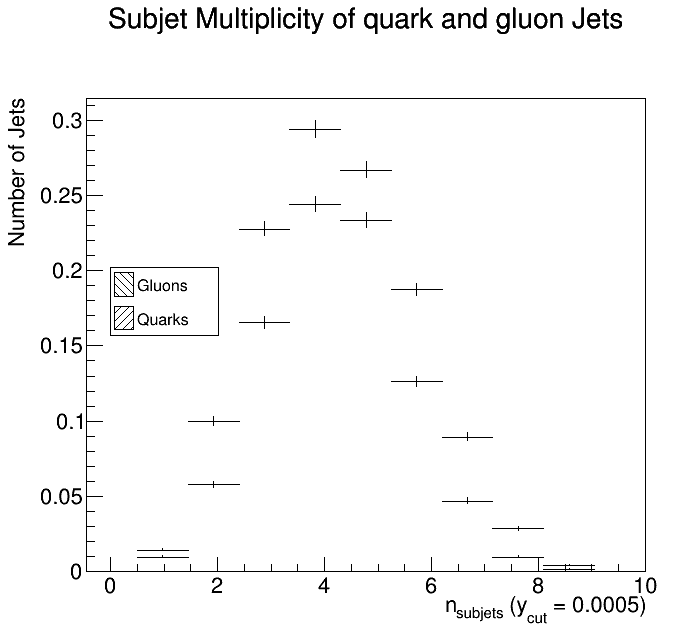
Code:
TFile *f = new TFile("jets.root");

   TCanvas *c = new TCanvas("c","c",800, 700);
   gStyle->SetOptStat(0);

   TH1F *h1 = (TH1F*)f->Get("nqsubJets");
   h1->Scale(1./h1->Integral(), "width");
   TH1F *h2 = (TH1F*)f->Get("ngsubJets");
   h2->Scale(1./h2->Integral(), "width");

   h1->SetFillStyle(3004);
   h1->SetFillColor(1);
   h2->SetFillStyle(3005);
   h2->SetFillColor(1);

   h1->Draw("");
   h2->Draw("SAME");

   h1->GetXaxis()->SetTitle("n_{subjets} (y_{cut} = 0.0005)");
   h1->GetYaxis()->SetTitle("Number of Jets");
   h1->SetTitle("Subjet Multiplicity of quark and gluon Jets");
   h1->GetXaxis()->SetRangeUser(0,10);
   h1->SetLineColor(1);
   h2->SetLineColor(1);
   // c->Modified();

   TLatex *t = new TLatex();
   t->SetTextFont(42);
   t->SetTextSize(0.026);
   t->DrawLatex(6,2500,"Thick Jets #rightarrow");
   t->DrawLatex(1.2,2500,"#leftarrow Thin Jets");
   t->DrawLatex(7.5,2000,"E_{T}^{jet} > 8 GeV");
   t->DrawLatex(7.5,1850,"-1 < #eta_{jet} < 2.5");
   t->DrawLatex(7.5,1500,"PYTHIAv8.306");
   t->Draw("same");

   auto legend = new TLegend(0.18,0.5,0.315,0.6);
   legend->AddEntry(h2,"Gluons","f");
   legend->AddEntry(h1,"Quarks","f");
   gStyle->SetLegendFont(42);
   gStyle->SetLegendTextSize(0.025);
   gStyle->SetLegendBorderSize(0);

   legend->Draw("");
   c->SetBottomMargin(0.15);
   c->SetLeftMargin(0.15);
   c->SetRightMargin(0.15);
   c->SetTopMargin(0.15);
   c->Print("qandg_nsubjets.pdf");
ROOT Version: 6.24.06