Hi,everyone.
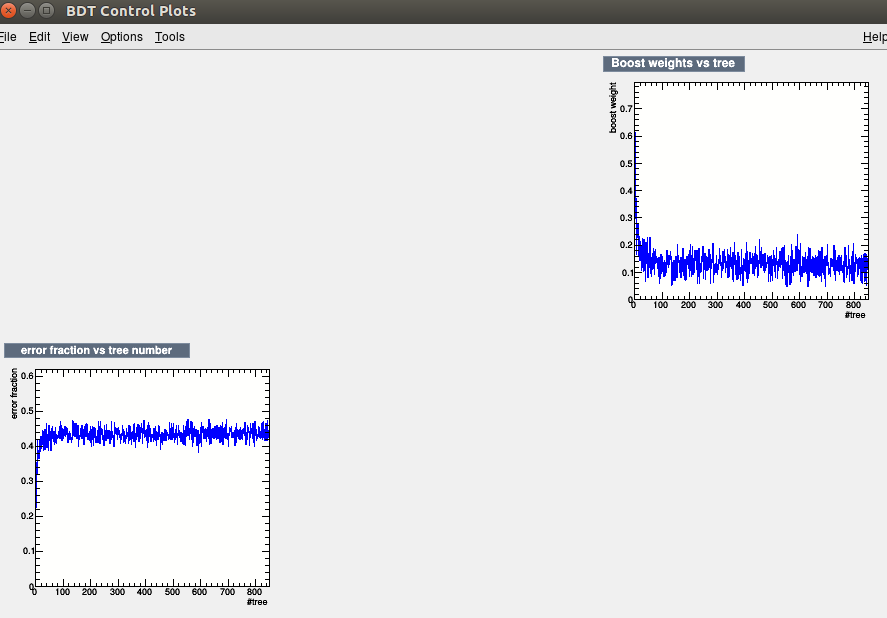
Regarding the toolkit of TMVA, I find that when I use “BDT” method( root -l ./TMVAClassification.C(“BDT”) ) ,the GUI pad could show me some analytical figures,for example the BDT boost weight distribution ,the error weight distribution.
However,when I concentrate on “BDTG” method( root -l ./TMVAClassification.C(“BDTG”) ),the GUI pad cannot open the relevant analytical figures.
I would like to know how can I obtain the analytical figures of analytical figures
Sincerely hope anyone who understands this question could provide some solutions.thanks!!!
@moneta should know (or at least he should know who can help)
Hi,
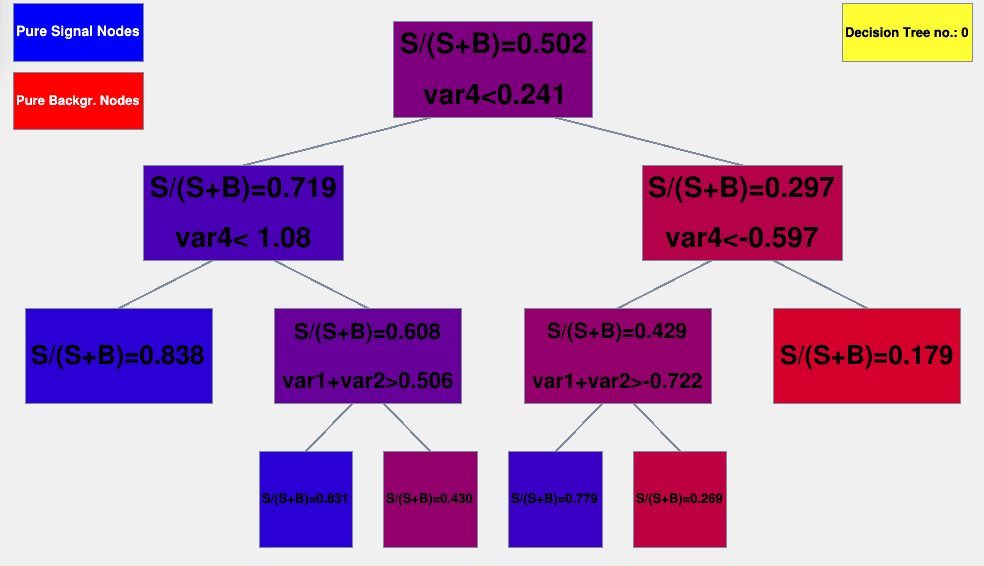
As far as I know the button “(10) Decision Trees (BDT)” does work for both BDT and BDTG with the caveat that the separation is shown in the leaf nodes (which is not relevant to gradient boosted trees). This means you can investigate the structure with this plot, but not calculate the output.
For the control plots: Firstly, I’m curious, for what purpose do you want to look at the misclassification rate for the BDTG?
“Boost weights vs tree” is not relevant for gradient boosting. The algorithm weights each tree with 1.
For “error fraction vs tree number” this is the number of misclassified events during the training process. This is relevant in particular for adaboost, which uses the reweighting of (misclassified) events as an integral part of the training process. Gradient boosting operates in a different way (functional approximation of the loss gradient), so the misclassification rate is not automatically calculated.
It is possible to implement the plots for BDTG, and allocating time is easier if we can motivate a use case, so please help us here 
Cheers,
Kim