Hello rooters,
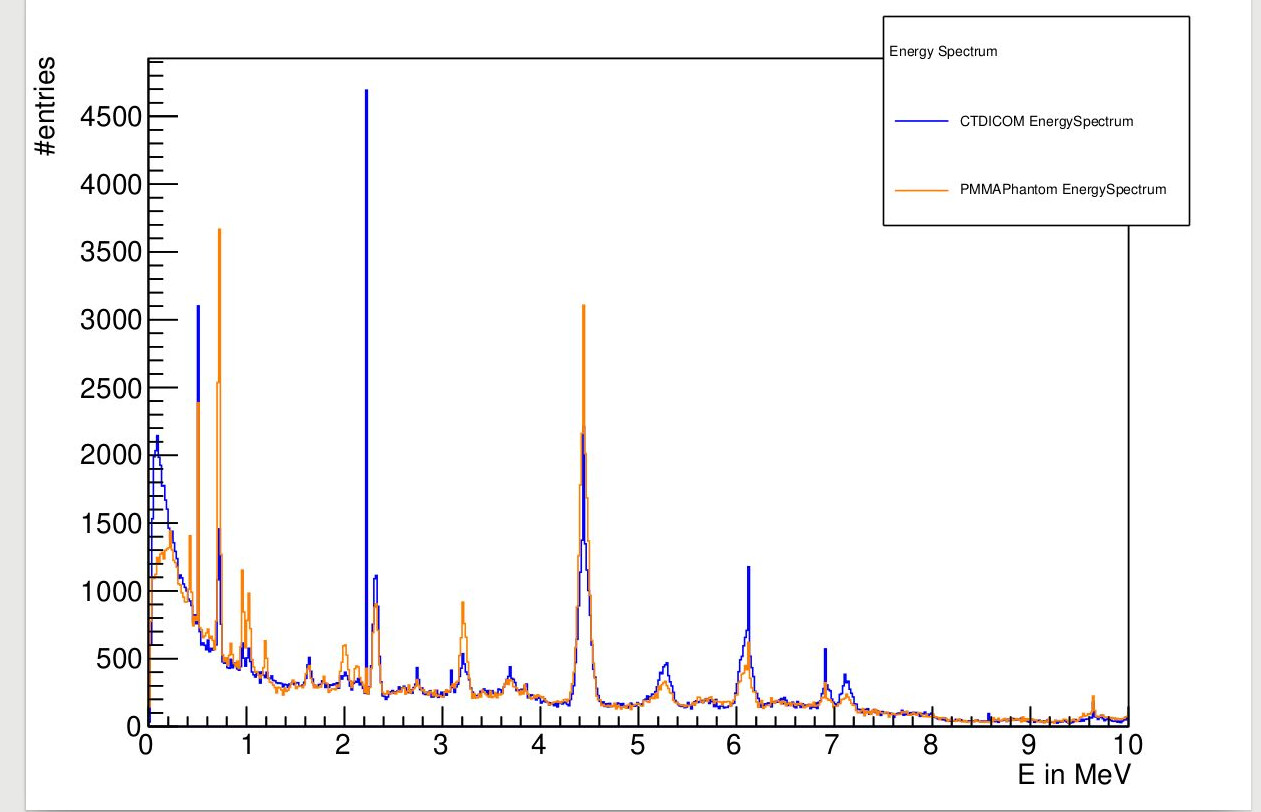
I have 2 Root files from two different Simulation and as seen in the image is a comparison between energy spectrum of prompt gamma radiation produced from proton interactions. Since this is the last part of my thesis I want a help in this part please.
I want to Calculate the number of entries in some peaks in the histograms and since those entries are absolute number I want also to normalize the Histogram, moreover drawing error bar graph of uncertainties of both histograms and compare between them.
-peaks of interest are (0.71, 2.3, 4.43, 6.128) MeV.
I did a simple code to calculate number of entries in a specific peak but since each peak has an energy range I estimated binX1 and binX2 on X-axis by eye. but I want to do it by a scientific way to be accurate as possible.
Any help would be appreciated
Thanks in Advance
Mo
I have modified over last 2 days the code to get the Peak integral of a Specific peak but I am not pretty sure if I am correct or not.
- in the attachment you will find the modified code use root file in the main post
DrawPeakIntegral.cpp (6.4 KB)
- in the photo attached you will see the output from the code.
Try something like this ("h" is a pointer to your histogram):
TF1 *f = new TF1("f", "gausn(0) + pol1(3)"); // normalized gaussian peak + linear background
f->SetParNames("Area", "Mean", "Sigma", "p0", "p1");
Double_t xmin = 4.2, xmax = 4.7;
// set "reasonable" initial values for all parameters
f->SetParameters(h->Integral(h->FindFixBin(xmin), h->FindFixBin(xmax), "width"), // "Area"
                 (xmax + xmin) / 2., (xmax - xmin) / 10., // "Mean", "Sigma"
                 0., 0.); // "p0", "p1"
h->Fit(f, "L", "", xmin, xmax); // Loglikelihood fit from "xmin" to "xmax"
std::cout << "Gaussian peak's integral = "
          << f->GetParameter(0) / h->GetBinWidth(h->FindFixBin(f->GetParameter(1)))
          << " +- "
          << f->GetParError(0) / h->GetBinWidth(h->FindFixBin(f->GetParameter(1)))
          << std::endl;
Thanks a lot for your reply 
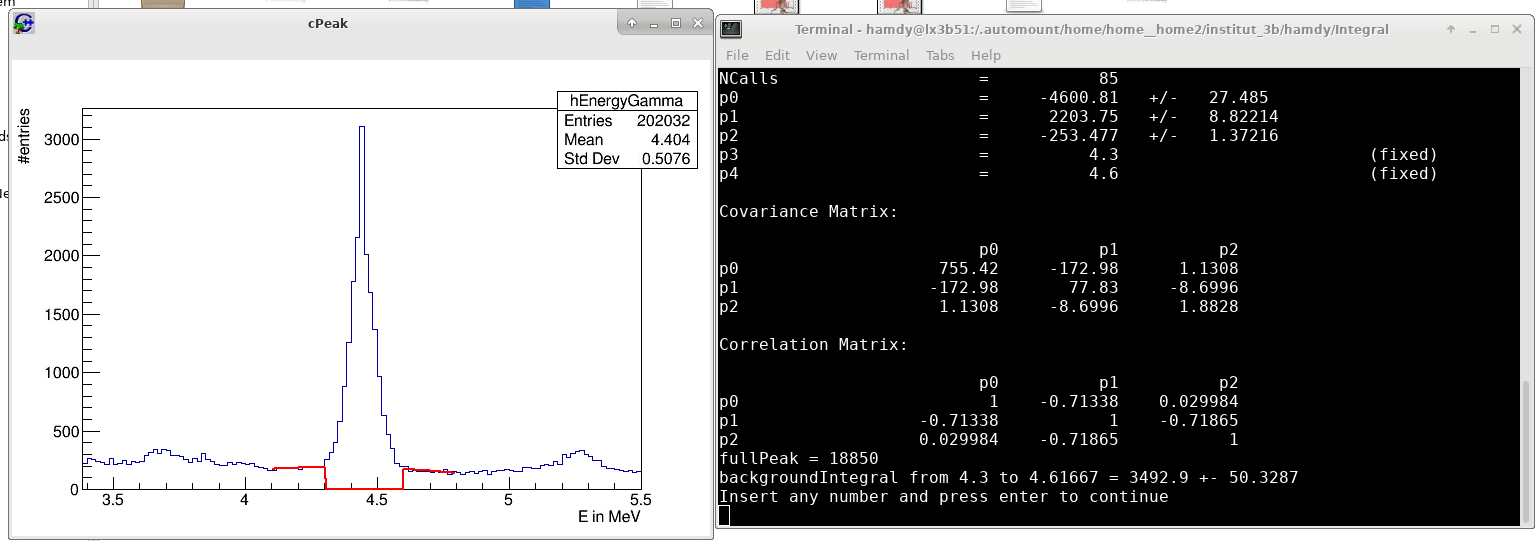
I applied these lines in the Code and I got this Graph after commenting part of the code and I do not know if it is correct or not and, if yes, where is the information about Peak Integral.
- The code used for this output Histogram is the following one:
DrawPeakIntegral.cpp (7.0 KB)
Sorry if I am little bit Stupid in my question but I am new to root and my programming skills are not advanced.
The fit misbehaved due to a very bad initial value of the Gaussian peak’s “Area” parameter (I corrected its estimating formula and added the fitted Gaussian peak’s integral printout in my previous post above).
Thanks a lot for your reply.
I applied the update and the fitting is better but it exclude the upper part of the peak and I should include all the peak with this small smear on the top as shown as follows:
- Another point also here, that I give the range of Xmin and Xmax which I estimate it as I want by eye but the point here is there is a possibility to choose this range with a piece of lines that could help me in this.
Thanks in advance
The “xmin = 4.3, xmax = 4.6” range is too narrow. You’d better try with “xmin = 4.2, xmax = 4.7” or “xmin = 4.1, xmax = 4.8”.
If the returned fit status says “converged” but the function does not really follow data points (try to draw it from 4 to 5 in order to see it better) then maybe the peak’s shape is not gaussian.