I am writing a simulation application that uses TFile and TTree to generate the output.
I recently found out that the bottleneck of my application is the IO. I am writing 2 trees into 2 different files.
I tried to save all the events in the RAM using a buffer and then to write everything at once on the disk but it doesn’t really save the day in terms of performance. I am sure there is such a system available in ROOT.
What kind of writing throughput are you getting, and what kind of throughput would you expect, ideally, given your hardware?
TTree already does some in-memory caching: it compressed the data and flushes to disk every once in a while. You can tweak TTree’s autoflush and autosave settings to make these in-memory caches larger.
You could also use TBufferMerger to write from multiple threads into the same TTree concurrently, see e.g. this tutorial.
In case compression is taking a long time, you can also change the compression algorithm, e.g. lz4 produces larger files but it’s much faster. zstd provides a good balance between speed and compression factor.
However, if you are writing to a spinning disk or to a network storage, the biggest gain would be to switch to writing to a fast SSD and only later copy the files to their final location.
It would be useful to see some performance profiling outputs, e.g. a CPU flamegraph to see whether there is some obvious problem.
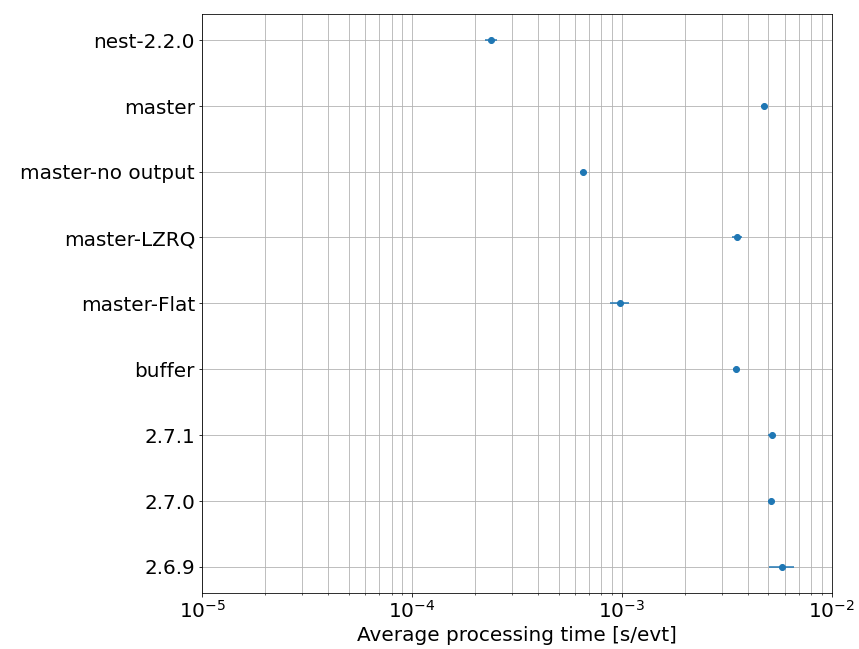
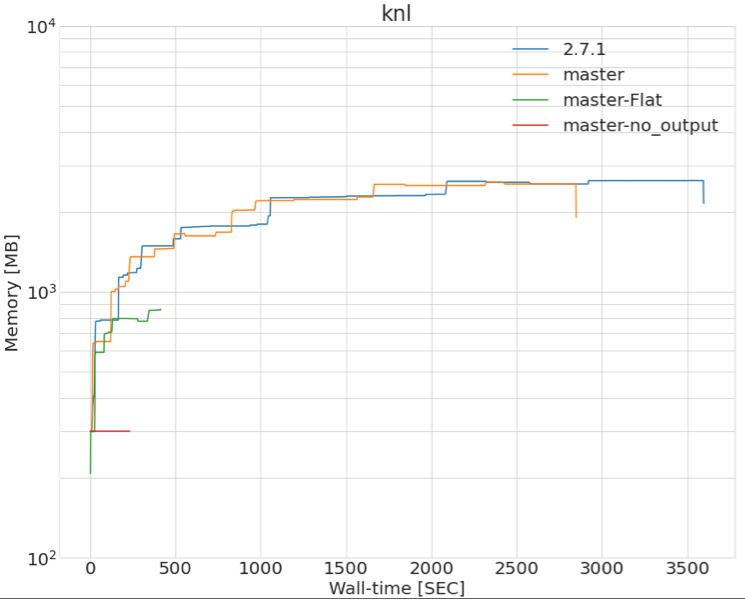
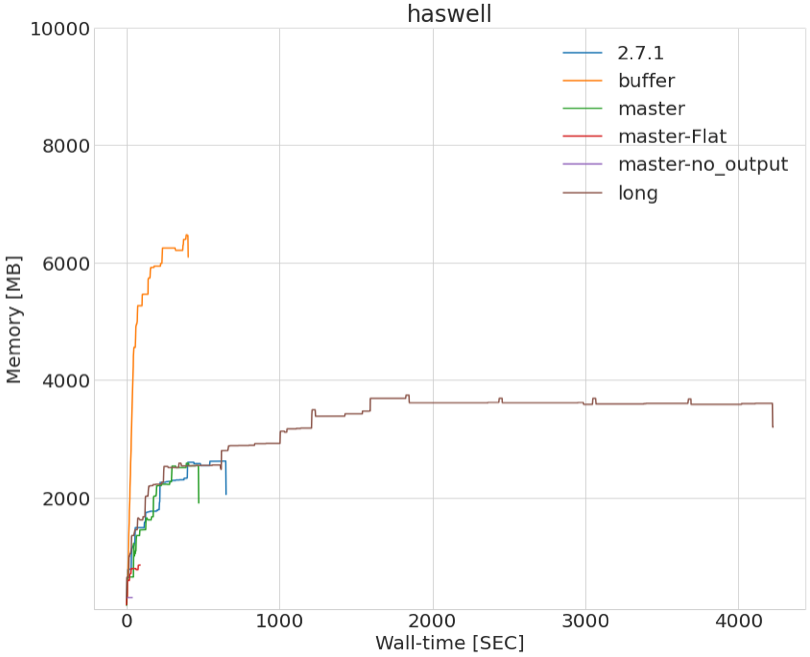
I attached a plot showing some performance benchmarking tests using different configurations.
nest-2.2.0 represents our “ultimate” goal in terms of performance as this is one of the libraries that we are using the most in the code.
master represents our code with all the output files turned ON
master-no output represents the execution of the code with all output files turned OFF
master-LZRQ represents the execution of the code with only the data RQs output turned ON (a complex object)
master-flat represents the execution of the code with only the flat table output turned ON
buffer is an attempt to store all the event objects in a buffer and to write them at the end
the rest are just different versions of the software.
Ideally, I would love to have master as close as possible from master-no output .
Do you think some optimization on the data RQs output would make the situation better ?
Try to play with the “compress” parameter (specifies the compression algorithm and level) when opening the output file (see the TFile::TFile constructor description for details).
Also, you may try to play with the “bufsize” parameter (when the buffer is full, it is compressed and written to disc) when creating tree branches (see the TTree class description for details).
On a similar topic, it looks like we are having a memory leak that I am not able to understand.
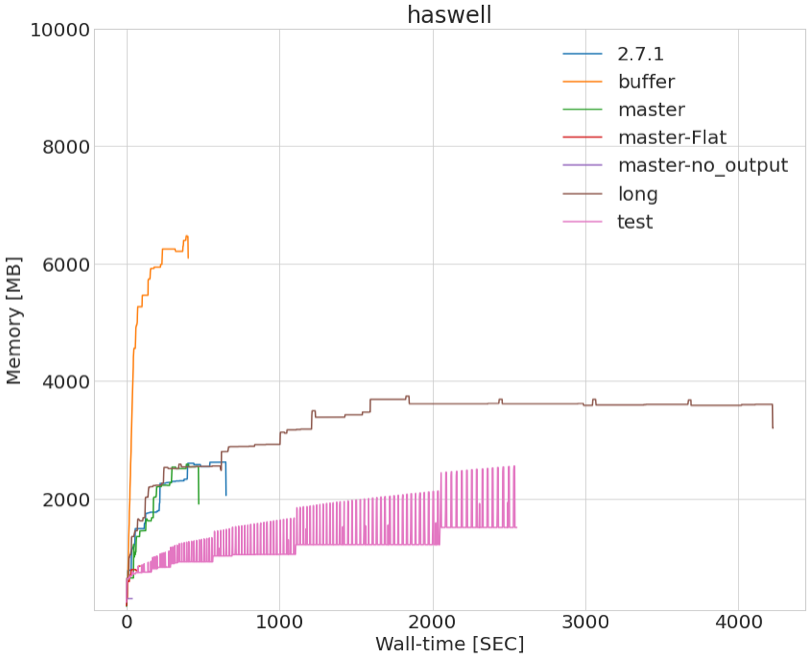
The attached plot shows the memory usage profile made with prmon.
For the naming of the different tests, I am using the same way described in my second post.
What concerns me is that the memory usage is continuously growing and it seems to be related to TTree::Fill according to memory mapping. Any idea where this might come from? Is there any way to reduce that ?
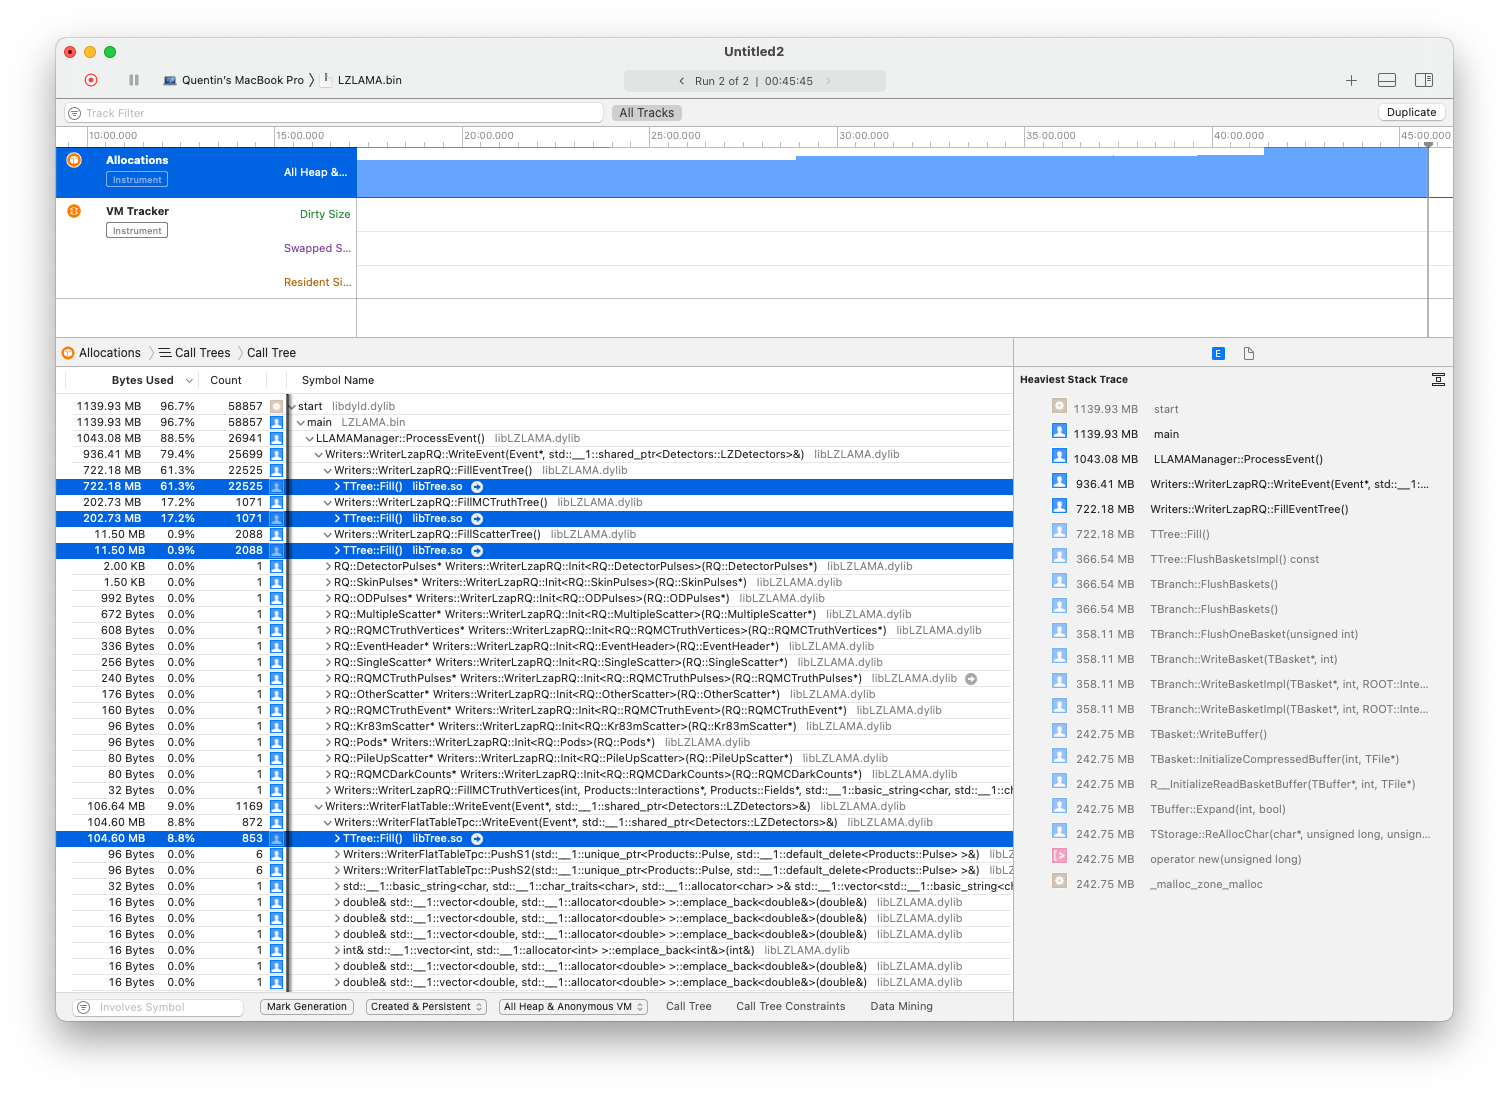
In order to complete my previous post, here is a screenshot of the memory mapping mad using macOS instruments. TTree::Fill takes the most important fraction of the memory.
Did I mis-understood or are you trying to keep the TTree in memory before writing it? If that is the case, doesn’t it make sense that TTree::Fill memory use would grow (to keep the data) until it is written?
I tried to save all the events in the RAM using a buffer and then to write everything at once on the disk but it doesn’t really save the day in terms of performance
Why would it save the day in term of performance? Wouldn’t incrementally write to the disk (hence possibly taking advance of the kernel’s implicit asynchronous I/O) and possibly overlap it with calculation help rather than waiting and do all the I/O at once?
The idea of using a buffer was to do the writing in a block at the end of the processing. I had in mind that grouping the IO is a good idea.
In you case, likely not. It might not save any I/O time and the cost in memory to cache the data may cost even more in triggering swapping.
For these tests, I wasn’t doing any optimization for the buffering yet. I am just trying to understand the memory usage.
According to the graph, it seems that the memory usage is plateauing, right?
If it is not case and the growth is more or so linear with time then the TTree might not be associated with a TFile and thus you are (inadvertently) buffering the data.
If it is indeed plateauing then it normal (the memory growth until (more or so) the basket can hold the data for a full cluster) and a little bit per cluster to keep track of the location of the data in file).
In that later case, you can control the memory cost by tweaking the cluster size (TTree::SetAutoFlush).
I made an other plot including a longer test: it looks like it plateaus after a long time to reach ~3.8 GB.
For the system I am using ~3.8 GB is too large.
Yes (note that either the f->cd(); or the SetDirectory are sufficient).
For the system I am using ~3.8 GB is too large.
According to the profile you sent, the LZapRQ Event TTree takes the most space. Can you send the result of that_tree->Print() for a completed (i.e. has all the events in it) file.
The tree has 493 branches each with their own basket. The most common basket size are 860160 bytes and 156672 bytes and there are several larger ones. So this is plausible that it uses the amount of memory you use.
To investigate a bit more, what is the value of that_tree->GetCacheSize() and that_tree->GetAutoFlush() as well as the output of that_tree->Print("clusters")
Looks like this is a protected member of the TTree:
root [7] Events->GetCacheAutoSize()
ROOT_prompt_7:1:9: error: 'GetCacheAutoSize' is a protected member of 'TTree'
Events->GetCacheAutoSize()
        ^
/usr/local/Cellar/root/6.22.06_1/include/root/TTree.h:177:21: note: declared protected here
   Long64_t         GetCacheAutoSize(Bool_t withDefault = kFALSE) const;
Anyway the crux is the problem is per se the compression factor.
The default cluster size is around 32Mb of compressed data but that file has an average compression factor 8.24.
The File size (after compression is 747,136,785 bytes which divided by the 25 cluster gives 29,885,471.40 bytes per cluster (i.e. the expected size).
However, the TTree is requested to hold one cluster is memory before writting so it so, it need at least 30MB * 8.24 = roughly 250MB and if you factor in that if one the basket reached the limit it will double the size, I an easily see a usage of 500MB after a while.
So you have 2 avenues to reduce the memory usage.
One is to address the source of the high compression factor (i.e. maybe there are many array with a lot of zeros that could be stored in memory sparsely instead).
Another, simpler solution, is to reduce the size of the cluster. For example calling:
that_tree->SetAutoFlush( -3200000 );
should reduce the memory use by a factor 10.
Or you can try to set the cluster size base on the number entry rather than the compressed size:
that_tree->SetAutoFlush( 10000 ); // The size in your file is 38,984
should keep the memory use by a factor 4. (Obviously you can pick any number to fit your need ).
Just to see the impact, I tried to set that_tree->SetAutoFlush( 10 );. I can now see the spikes due to buffering and writing (pink curve labeled test). It highly impacted the performance but it’s nice to see that. I am going to see how I can improve the performance with different parameters.
In any case, a simplification of the data we are saving seems to be the only route to have a significant gain in performance.
 ).
).