Dear root expert,
I have code which works and give me the plot I expected and from that I have filter using a butterworth filter oftenly used in matlab, does anyone have any idea of how to do it ?
I am attaching my code:
#include "TROOT.h"
#include "TObject.h"
#include "TFile.h"
#include "TTree.h"
#include "TH2.h"
#include "TMath.h"
#include "TGraph.h"
#include "TColor.h"
#include "TCanvas.h"
#include "TLegend.h"
#include <TStyle.h>
#include <TSpectrum.h>
#include <iostream>


#include "TROOT.h"
void plotingItkProject_test()

{

  TCanvas *c1 = new TCanvas("c1");
  TPad* thePad = (TPad*)c1->cd();
  thePad->SetTicks();
  TString file_response[]={"./Responses.20190526185617.txt","./source.txt"};
  const int  Npoints = 20000;
  int chan = 4;
  double response_ch[chan][Npoints];
  double source_ch[chan][Npoints];
  //double response_ch2[Npoints];
  TString tmps;
  ifstream fin_chan_response(file_response[0]);
  ifstream fin_chan_source(file_response[1]);
  //ifstream fin_ch2(file_response[0]);
  TGraph *gr_ch1  = new TGraph (Npoints);
  TGraph *gr_ch2  = new TGraph (Npoints);
  TGraph *gr_ch3  = new TGraph (Npoints);
  TGraph *gr_ch4  = new TGraph (Npoints);
  TH1D* ch1_hist = new TH1D("ch1_hist","channel 2;#lambda;Power[dB]",20000,1460-0.004,1620+0.004);

  //reading the header file which is not used
  for (Int_t j=0; j<132; j++)
    {
      fin_chan_response >>tmps;

    }

  //reading the 4 channels which coantains 20000 point each of them

  for (Int_t i=0; i<chan; i++)
    {
      for (Int_t j=0; j<Npoints; j++)
	{

	  fin_chan_response>>tmps;response_ch[i][j]=tmps.IsFloat()?tmps.Atof():0;
	  fin_chan_source>>tmps;source_ch[i][j]=tmps.IsFloat()?tmps.Atof():0;

	}

    }
  double  wavelength[Npoints];
  for ( Int_t j=0; j<Npoints; j++)
    {
      wavelength[j] = j*0.008+1460;
    }

  for ( Int_t j=0; j<Npoints; j++)
    {

      gr_ch1->SetPoint(j,wavelength[j],-1*response_ch[0][j]);
      gr_ch2->SetPoint(j,wavelength[j],-1*response_ch[1][j]);
      gr_ch3->SetPoint(j,wavelength[j],-1*response_ch[2][j]);
      gr_ch4->SetPoint(j,wavelength[j],-1*response_ch[3][j]);
      ch1_hist->Fill(wavelength[j],(response_ch[1][j]-source_ch[1][j]));
      ch1_hist->SetBinError(j,0.005);

    }

  ch1_hist->Draw("l");


}
The input file of the code can be found in dropbox, this is the link: #include "TROOT.h"
#include "TObject.h"
#include "TFile.h"
#include "TTree.h"
#include "TH2.h"
#include "TMath.h"
#include "TGraph.h"
#include "TColor.h"
#include "TCanvas.h"
#include "TLegend.h"
#include <TStyle.h>
#include <TSpectrum.h>
#include <iostream>


#include "TROOT.h"
void plotingItkProject_test()

{

  TCanvas *c1 = new TCanvas("c1");
  TPad* thePad = (TPad*)c1->cd();
  thePad->SetTicks();
  TString file_response[]={"./Responses.20190526185617.txt","./source.txt"};
  const int  Npoints = 20000;
  int chan = 4;
  double response_ch[chan][Npoints];
  double source_ch[chan][Npoints];
  //double response_ch2[Npoints];
  TString tmps;
  ifstream fin_chan_response(file_response[0]);
  ifstream fin_chan_source(file_response[1]);
  //ifstream fin_ch2(file_response[0]);
  TGraph *gr_ch1  = new TGraph (Npoints);
  TGraph *gr_ch2  = new TGraph (Npoints);
  TGraph *gr_ch3  = new TGraph (Npoints);
  TGraph *gr_ch4  = new TGraph (Npoints);
  TH1D* ch1_hist = new TH1D("ch1_hist","channel 2;#lambda;Power[dB]",20000,1460-0.004,1620+0.004);

  //reading the header file which is not used
  for (Int_t j=0; j<132; j++)
    {
      fin_chan_response >>tmps;

    }

  //reading the 4 channels which coantains 20000 point each of them

  for (Int_t i=0; i<chan; i++)
    {
      for (Int_t j=0; j<Npoints; j++)
	{

	  fin_chan_response>>tmps;response_ch[i][j]=tmps.IsFloat()?tmps.Atof():0;
	  fin_chan_source>>tmps;source_ch[i][j]=tmps.IsFloat()?tmps.Atof():0;

	}

    }
  double  wavelength[Npoints];
  for ( Int_t j=0; j<Npoints; j++)
    {
      wavelength[j] = j*0.008+1460;
    }

  for ( Int_t j=0; j<Npoints; j++)
    {

      gr_ch1->SetPoint(j,wavelength[j],-1*response_ch[0][j]);
      gr_ch2->SetPoint(j,wavelength[j],-1*response_ch[1][j]);
      gr_ch3->SetPoint(j,wavelength[j],-1*response_ch[2][j]);
      gr_ch4->SetPoint(j,wavelength[j],-1*response_ch[3][j]);
      ch1_hist->Fill(wavelength[j],(response_ch[1][j]-source_ch[1][j]));
      ch1_hist->SetBinError(j,0.005);

    }

  ch1_hist->Draw("l");


}
The input file of the code can be found in dropbox in this link: https://www.dropbox.com/sh/poxygltmdlxy1g7/AADJeOQ4JlGBVSE36y77FijZa?dl=0 (the two last files)
I attached the results of my code named as ch2_channel.root ch2_channel.root (39.1 KB)
I also attached the results of what I expect to have after filtered (the results comes from a matlab code, the red smooth line) named as rawVSfiltered 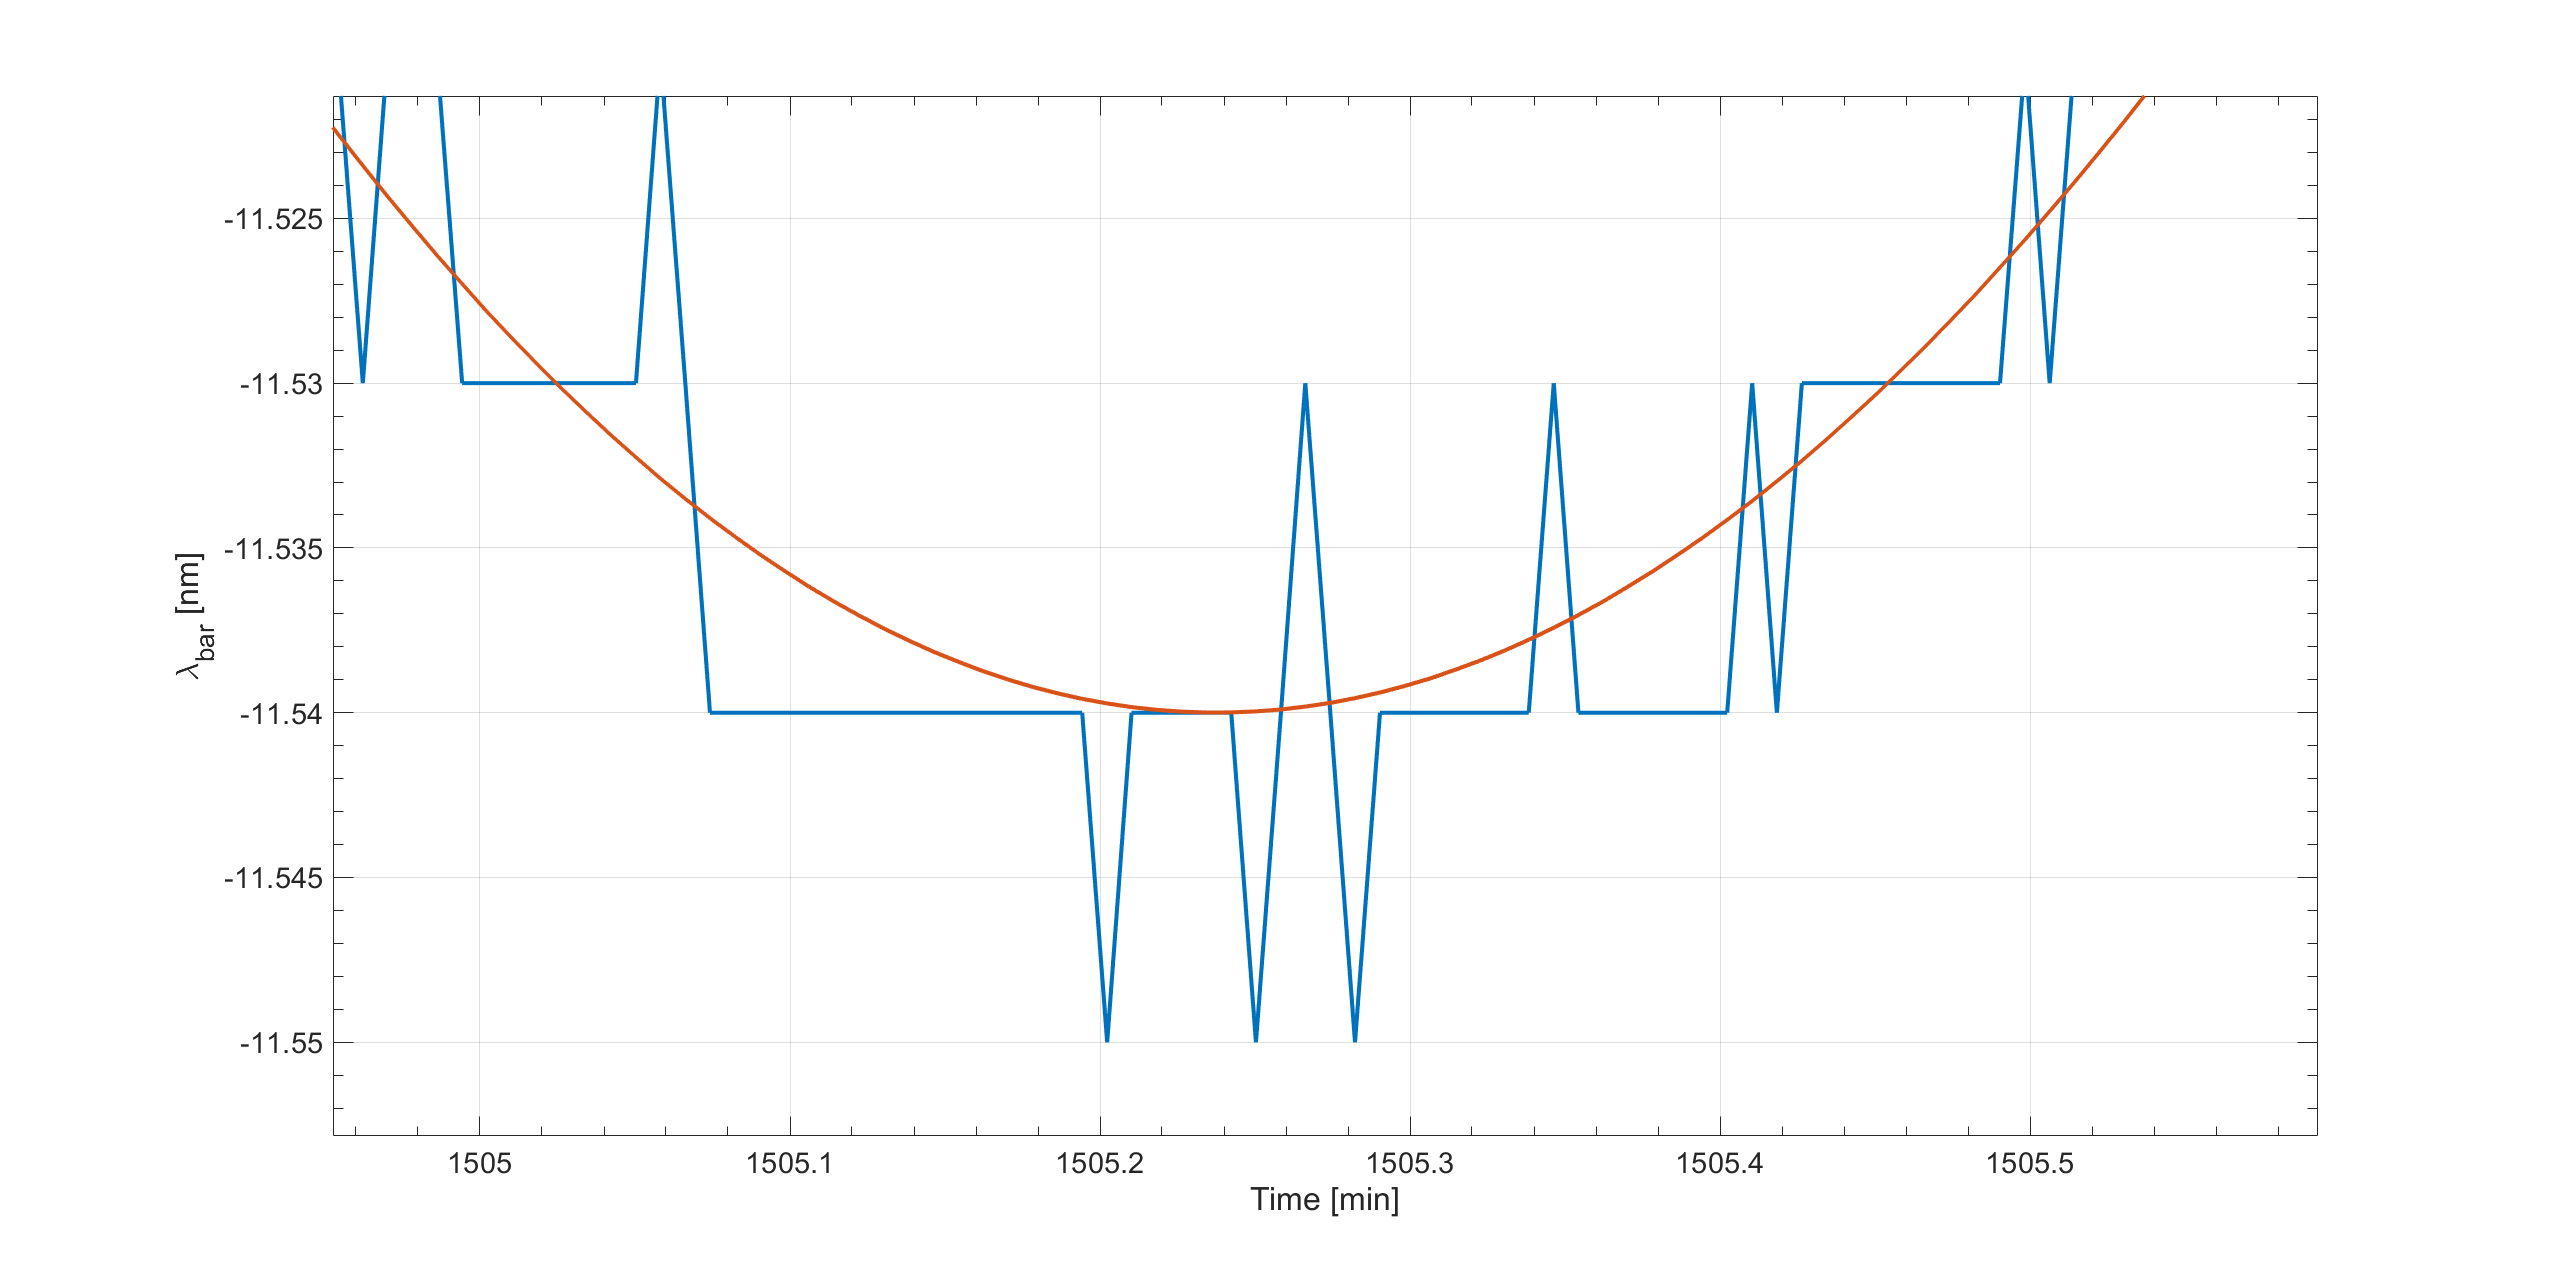 .
.
Thanks in advance,
Best Regards,
Diallo.
ROOT Version: Not Provided
Platform: Not Provided
Compiler: Not Provided