Dear Rooters
I am seeking the number of counts under a peak
I create a histogram then I fit my peak using Gaussian fitting, I can get the parameters for this fitting and sure could calculate the total number under the peak.
But if I change the binning and re-fit the same peak, I will get different parameters, as well different values of the event under the peak
TH1D *en0 = new TH1D(“energy0”, “energy”,2000,0.5,2000.5);
Double_t par[3];
TF1 *gaus = new TF1(“gaus”,“gaus”,1171,1176);
energy0->Fit(gaus,“R”);
int line_content =energy0->Integral(1171,1176);
printf(“Integral of function = %g\n”,line_content);
…
TH1D *en1 = new TH1D(“energy1”, “energy”,20000,0.5,2000.5);
Double_t par[3];
TF1 *gaus1 = new TF1(“gaus1”,“gaus”,1171,1176);
energy1->Fit(gaus1,“R”);
int line_content =energy1->Integral(1171,1176);
printf(“Integral of function = %g\n”,line_content);
for me both scripts are correct, the binning issues should not change the parameters, if I am still at the same range of my spectrum.
thank you for reply
I am wondering about the fitting parameter not the integral, from the fitting parameters I would be able to find the area under the peak.
and why I need to change the range, because from fitting plot, I can see that I am on the requested peak.
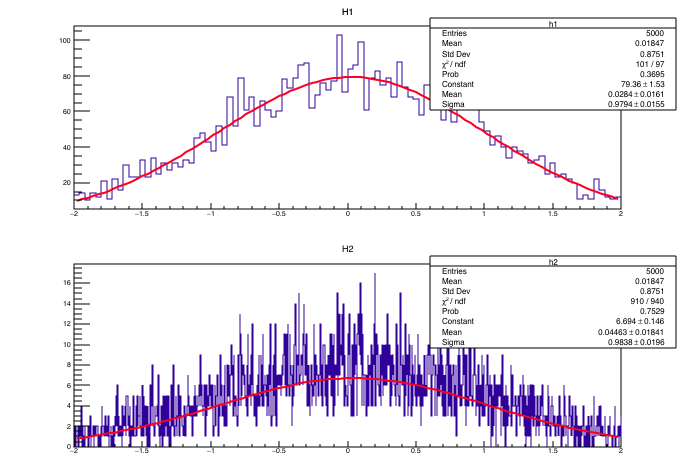
Which parameter is changing? The constant of course will change because your bins will get taller as they get wider. The mean and sigma should stay fixed (within uncertainty of course).
{
   gStyle->SetOptFit(11111);

   TH1F *h1 = new TH1F("h1","H1",100,-2,2);
   TH1F *h2 = new TH1F("h2", "H2", 1000, -2, 2);

   for (int i=0;i<5000;i++) {
      double rand = gRandom->Gaus();
      h1->Fill(rand);
      h2->Fill(rand);
   }

   TF1 *f1 = new TF1("f1","gaus");
   TF1 *f2 = new TF1("f2","gaus");

   TCanvas *c = new TCanvas("c","C");
   c->Divide(1,2);
   c->cd(1);
   h1->Fit(f1,"EM");
   c->cd(2);
   h2->Fit(f2,"EM");
}
Yes thank you for assistance.
I got something like this, but eventually we calculate the number of event under the peak by using the constant parameter,
so the total number of events( or number of counts-I have gamma spectrum) will be different
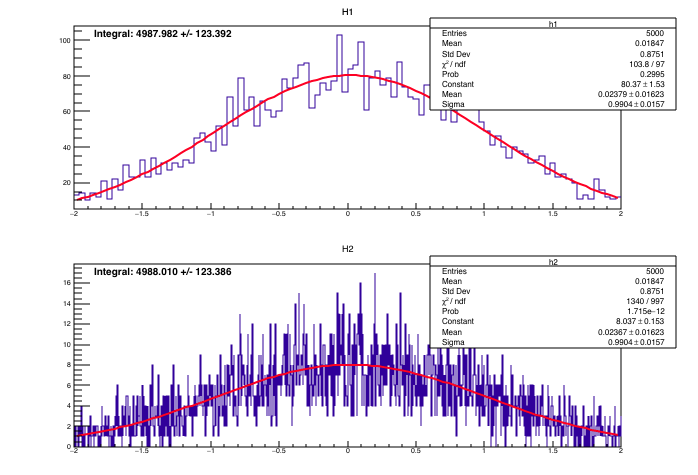
N of counts= ConstantSigmaSqrt(2pi) ???
once the constant is different, the area is different. so basically binning is not just a drawing option, it has direct effect on the analysis
I really appreciate your assistance since I am still beginner on root.
from your spectra, what are the area under the fitting curves (not the spectrum)??
it should be different!!
@Wile_E_Coyote has provided the appropriate solution. As I had stated earlier when computing the area under the curve one needs to account for the bin width.
Here is the example from above amended with wile’s suggestion: