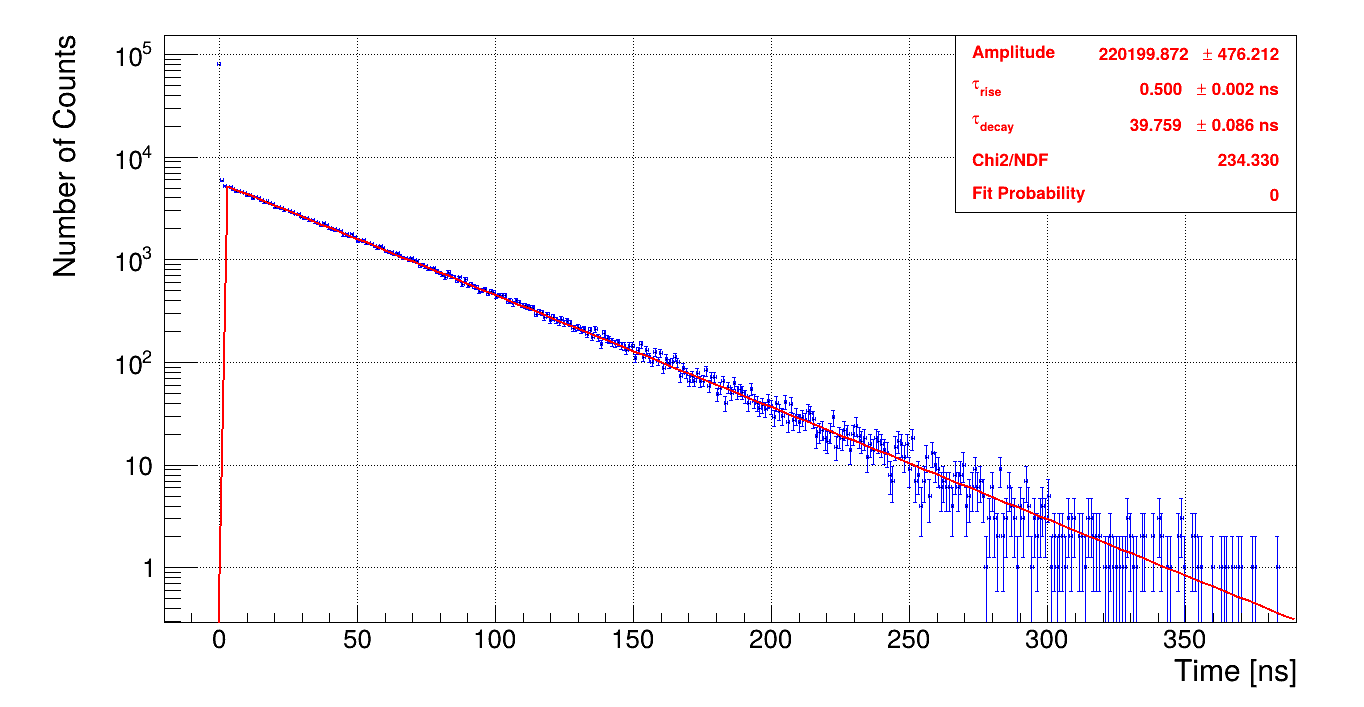
I am focusing on analyzing the global time to extract both the decay and rise times by applying a bi-exponential fit. However, I am encountering some challenges with the fitting process. Specifically, the chi-squared value of the fit is huge, and the second rise time appears to be shorter than the first.
I am attaching reference images that illustrate the expected data, as well as my current output for your review. Any advice or suggestions on resolving these issues would be greatly appreciated.
This is my code
#include <TTree.h>
#include <TH1F.h>
#include <TCanvas.h>
#include <TF1.h>
#include <TPaveStats.h>
#include <TStyle.h>
#include <iostream>

void GLobalTimeVsPhotonCount() {
    // Style settings
    gStyle->SetOptStat(0);
    gStyle->SetOptFit(1111);
    gStyle->SetFitFormat("6.3g");
    gStyle->SetStatFormat("6.3g");

    // Open file and get tree with error handling
    TFile *file = TFile::Open("Outputtest.root");
    if (!file || file->IsZombie()) {
        std::cerr << "Error: Could not open file." << std::endl;
        return;
    }

    TTree *tree = dynamic_cast<TTree*>(file->Get("Photon_Hit"));
    if (!tree) {
        std::cerr << "Error: Could not find tree Photon_Hit." << std::endl;
        file->Close();
        return;
    }

    // Canvas setup
    TCanvas *c1 = new TCanvas("c1", "Time Spectrum", 1200, 800);
    c1->SetMargin(0.12, 0.05, 0.12, 0.05);
    gPad->SetGridx();
    gPad->SetGridy();
    gPad->SetLogy();

    // Histogram creation and filling
    double globalTime;
    tree->SetBranchAddress("GlobalTime_ns", &globalTime);

    TH1F *hist = new TH1F("hist", "Time Spectrum", 400, -20, 390);
    hist->GetXaxis()->SetTitle("Time [ns]");
    hist->GetYaxis()->SetTitle("Number of Counts");

    hist->SetLineColor(kBlue);

    Long64_t nEntries = tree->GetEntries();
    for (Long64_t i = 0; i < nEntries; ++i) {
        tree->GetEntry(i);
        hist->Fill(globalTime);
    }

    // Single exponential rise and decay fit function
    TF1 *fit_func = new TF1("fit_func",
        "[0] * (exp(-x/[2]) - exp(-x/[1])) / ([2] - [1])", -20, 400);

    // Set parameter names and initialize parameters
    fit_func->SetParName(0, "Amplitude");
    fit_func->SetParName(1, "#tau_{rise}");
    fit_func->SetParName(2, "#tau_{decay}");

    double max_val = hist->GetMaximum();
    fit_func->SetParameter(0, max_val); // Amplitude
    fit_func->SetParameter(1, 7);       // tau_rise
    fit_func->SetParameter(2, 10);      // tau_decay

    // Set limits on parameters to reasonable values
    fit_func->SetParLimits(0, max_val * 0.1, max_val * 5); // Amplitude
    fit_func->SetParLimits(1, 0.5, 10);                    // tau_rise
    fit_func->SetParLimits(2, 10, 100);                    // tau_decay

    // Fit histogram
    hist->Fit(fit_func, "REMN");

    // Draw the histogram with fit
    hist->SetTitle("");
    hist->GetXaxis()->SetTitleSize(0.045);
    hist->GetYaxis()->SetTitleSize(0.045);
    hist->GetXaxis()->SetLabelSize(0.04);
    hist->GetYaxis()->SetLabelSize(0.04);
    hist->Draw("E1");
    fit_func->Draw("same");

    // Get fit statistics
    double chi2 = fit_func->GetChisquare();
    double ndf = fit_func->GetNDF();
    double chi2NDF = chi2 / ndf;
    double prob = fit_func->GetProb();

    // Create TPaveStats box for fit information
    TPaveStats *stats = new TPaveStats(0.7, 0.7, 0.95, 0.95, "brNDC");
    stats->SetTextColor(kRed);
    stats->SetBorderSize(1);
    stats->SetFillColor(0);
    stats->SetTextAlign(12);

    // Add parameter values to stats box
    stats->AddText(Form("Amplitude = %.3f #pm %.3f", fit_func->GetParameter(0), fit_func->GetParError(0)));
    stats->AddText(Form("#tau_{rise} = %.3f #pm %.3f ns", fit_func->GetParameter(1), fit_func->GetParError(1)));
    stats->AddText(Form("#tau_{decay} = %.3f #pm %.3f ns", fit_func->GetParameter(2), fit_func->GetParError(2)));
    stats->AddText(Form("Chi2/NDF = %.3f", chi2NDF));
    stats->AddText(Form("Fit Probability = %.3g", prob));
    stats->Draw();


    // Print fit results to console
    std::cout << "\nDetailed Fit Results:" << std::endl;
    std::cout << "Chi2/NDF = " << chi2NDF << std::endl;
    for (int i = 0; i < fit_func->GetNpar(); ++i) {
        std::cout << fit_func->GetParName(i) << " = "
                  << fit_func->GetParameter(i) << " ± "
                  << fit_func->GetParError(i) << std::endl;
    }

    // Save canvas and fit results
    c1->SaveAs("time_spectrum_fit_single_exp_rise_decay.pdf");

    file->Close();
    delete c1;
}
This is the output image
Thank you in advance, and I look forward to your responses.
ROOT Version: 6.32.04
Platform: 22.04.1-Ubuntu
Compiler: C++
