I generated a pseudodata and fitted it.
here is is my situation:
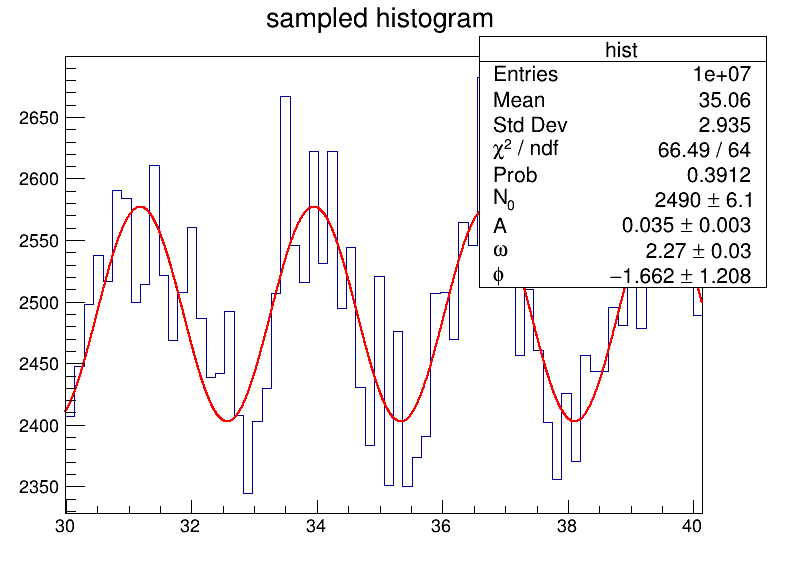
with hist.GetXaxis().SetRangeUser(30,40), the ndf on the fit results seems abnormal (less than expected, as i am fitting a histogram with 4000 bins from 0 to ~600 on xaxis) and the fit(-ted ?) function still drawn for the whole range of the histogram. if you comment out that line, the ndf goes normally.
vs
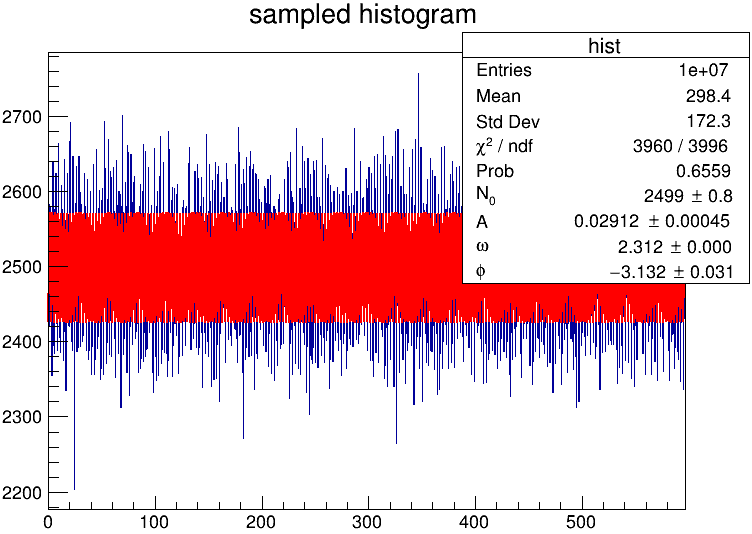
as far as i know, the GetXaxis().SetRangeUser do not affect the fitting range (only the function range does). so even you set a different range, the fit function still ‘sees’ and fit on the whole range on which the function was defined. am i just misunderstand something ?
attached is the code to reproduce the scenario.
import ROOT
ROOT.gStyle.SetOptFit(1111)

npts = 4000
plot_range = (30,40)
angular_freq = 39.8

gen_func = ROOT.TF1("gen_func","[0]*(1 + [1]*cos([2]*x + [3]))",0,npts*0.1492);
gen_func.SetParameters(1,0.5,angular_freq,0)
gen_func.SetNpx(npts*1)

hist = ROOT.TH1D("hist","sampled histogram",npts,0,npts*0.1492)
N = 10000000
hist.FillRandom("gen_func",N)

fit_func = ROOT.TF1("fit_func","[0]*(1 + [1]*cos([2]*x + [3]))",0,npts*0.1492);
fit_func.SetLineColor(2)
fit_func.SetNpx(npts)
fit_func.SetParNames("N_{0}","A","#omega","#phi")
# fit_func.SetParameters(2500,0.05,2.3,0)
fit_func.SetParameters(2200,0.06,2.3,0)

print("check parameters")
npars = fit_func.GetNpar()
for i in range(npars):
    print(fit_func.GetParameter(i))

# hist.GetXaxis().SetRangeUser(30,40)

c = ROOT.TCanvas("cc","c",800,600)
hist.Fit("fit_func","REM")
c.Draw()
ROOT Version: 6.24.00 (conda_forge)
Platform: ubuntu20.04 (wsl)
Compiler: gcc9