Greetings,
In the statistics box for a TH2, what exactly are the numbers in the 3x3 array? Something about underflow and overflow values, I imagine, but I can’t figure it out exactly.
I’m sorry for such a basic question, but I did look through the various doc and did not find a answer.
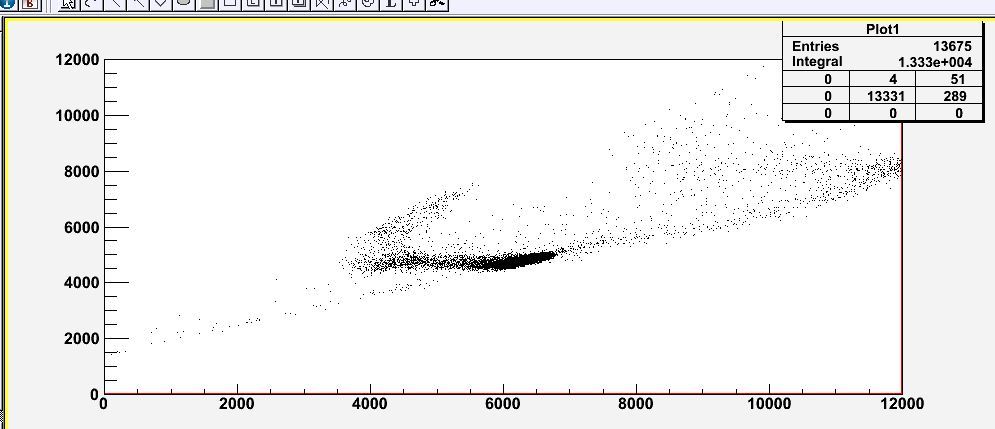
Pic p1 is a (un-zoomed) histogram, and shows the statistics values.
[attachment=2]p1.jpg[/attachment]
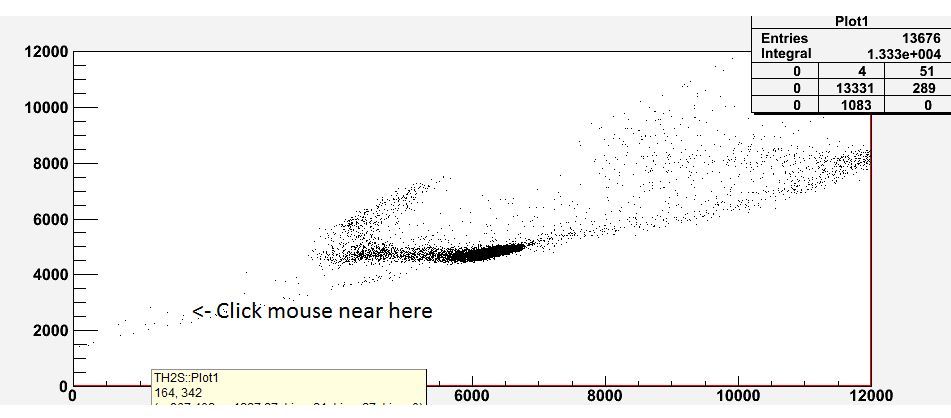
Pic p2 is after clicking the mouse once, approximately near the origin.
Why did the number 1083 show up in the stats box?
[attachment=1]p2.jpg[/attachment]
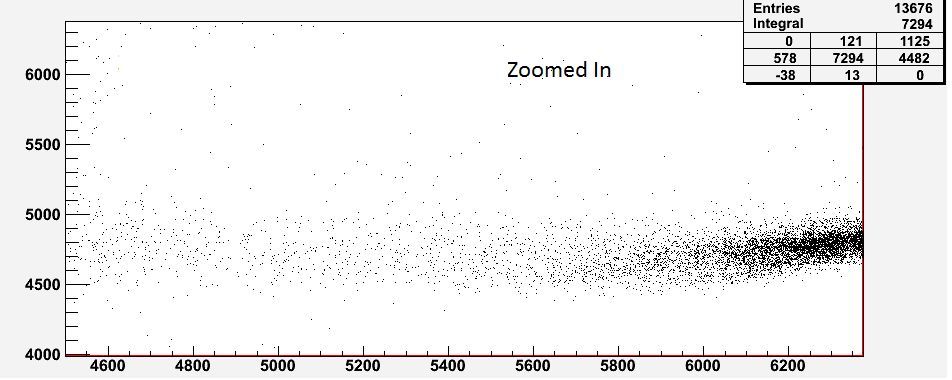
Pic p3 is zoomed in on both x and y. What does the -38 value in the stats box mean?
[attachment=0]p3.jpg[/attachment]
thanks,
buddy