Dear Rooters,
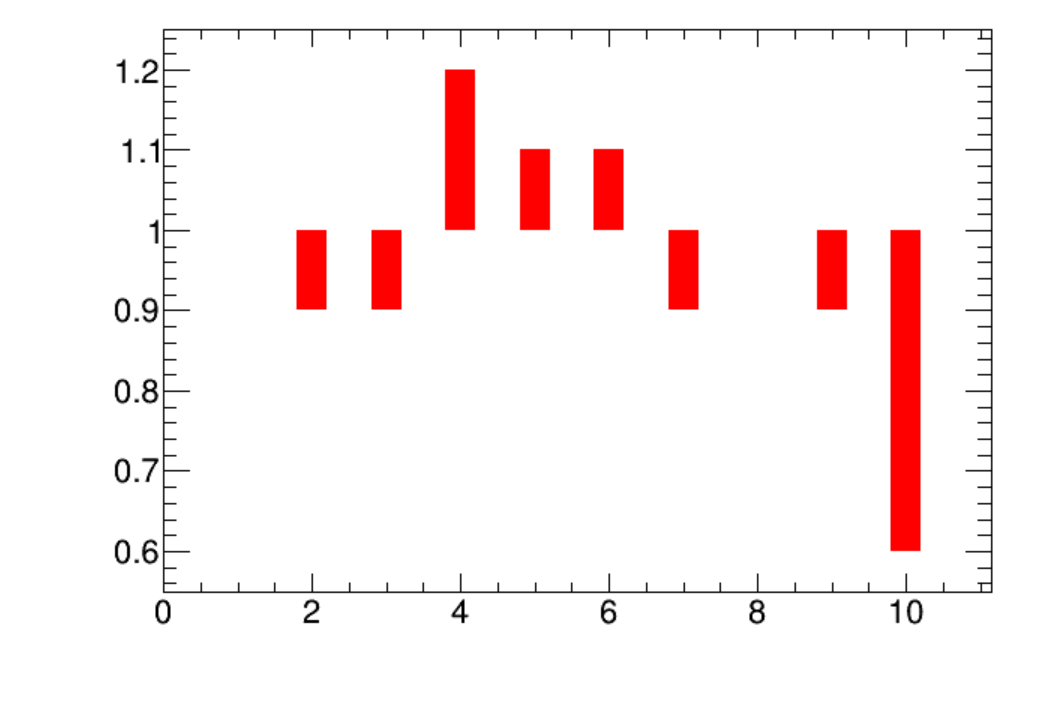
I would like to produce a graph like this screenshot:
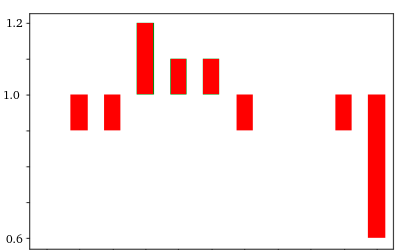
This could be a minimal working example to produce a similar graph
std::vector<double> x_v = {1.,2.,3.,4.,5.}
std::vector<double> y_v = {1.0, 0.9, 0.9, 1.2, 1.1 }
gr = new TGraph( x_v.size(), x_v.data(), y_v.data())
gr->SetFillColor(kRed)
gr->Draw("AB")
This code results in this plot:
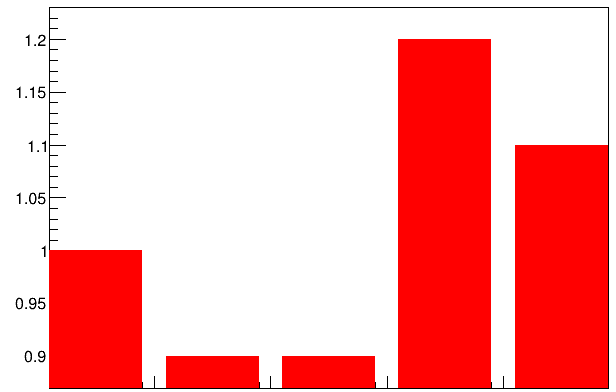
I would like the bars to start at 1 instead of zero, as in case of the first image. Is there a simply way to do it? I would prefer to avoid “tricking the data” (subtracting 1 to each element in y_v), because I would like also to plot it in logarithmic scale.
I spent some time looking for similar problems, but I found nothing. Sorry if this question was already answered.
Thank you for your time.
Cheers,
atd
ROOT Version: 6.20
Platform: Centos 8
Compiler: gcc 8.3