Bamboo: an analysis framework based on RDataFrame

I should have posted earlier, but didn’t know there was a “my ROOT app” category… anyway: I developed a python framework for the analysis of HEP data based on RDataFrame, called bamboo (see also the repository and documentation).
It mostly targets flat trees (where the branches contain simple numeric types and arrays of those) like CMS NanoAOD (the CMS open data format is very similar), and works as follows: based on the branches that are found (only the structure needs to be specified, not the full list of branches, so most differences between versions and data/MC do not need anything special), simple python classes are made that represent a lepton, a jet, a container of them etc. From these, expressions (mappings from an entry to a number or array) can be derived in compact python code, using a small set of helper methods, mostly for working with containers inside the same entry (event), and these can be used to define selection requirements and variables to plot (internally these are converted to C++ helper methods, which are declared with the cling interpreter, and RDataFrame nodes).

As an example, a plot with the sum of pT of jets with pT > 30 GeV that are not within 0.4 in ΔR of any electron or muon with pT > 10 GeV, for events with at least two muons with pT > 10 GeV, can be made as follows (see e.g. the implementation of the IRIS-HEP ADL benchmarks for a few more examples):

from bamboo import treefunctions as op
el10 = op.select(tree.Electron, lambda el : el.pt > 10.)
mu10 = op.select(tree.Muon    , lambda mu : mu.pt > 10.)
hasTwoMuons = noSel.refine("hasTwoMuons", cut=(op.rng_len(mu10) >= 2))
cleanedJets30 = op.select(tree.Jet, lambda j : op.AND(
    j.pt > 30.,
    op.NOT(op.rng_any(el10, lambda el : op.deltaR(j.p4, el.p4) < 0.4 )),
    op.NOT(op.rng_any(mu10, lambda mu : op.deltaR(j.p4, mu.p4) < 0.4 ))
    ))
plots.append(Plot.make1D("sumCleanedJetPt",
    op.rng_sum(cleanedJets30, lambda j : j.pt), hasTwoMuons,
    EqBin(100, 15., 200.), title="Sum p_{T} (GeV/c)"))

In the most common use case of filling a bunch of histograms for different selection stages, the user defines a python class that implements a definePlots method which returns a list of plots, and the input files are only processed once afterwards, when the histograms are retrieved. For the different selections there is a Selection object that keeps track of a set of cuts and weight factors, and is constructed by adding those to another selection (noSel above is the root of that hierarchy) - this maps to a Filter node (sometimes with a Define for the weight).

Having this python layer between the user code and RDataFrame also allows for some optimisation (expensive expressions are Defined and reused) and more advanced features: if configured to take jet systematic variations into account (with a bit of configuration code before), the fragment above will produce not one but 1+N histograms, and keep track of the associated RDataFrame graph branches (e.g. when plotting leading jet pT for events with two jets with pT > 30, there will be a Filter and attached Histo1D node for each variation). Since any C++ code can be called, it was also possible to reuse code to read a set of weights from a JSON file, and to calculate the jet variation on the fly (reusing the classes from CMSSW to read the corrections etc.).

The main benefit for the user is that the code to be written is a fairly compact representation of the actual analysis-specific choices (hence the link to analysis description languages), which helps to keep the overview, while the technicalities of turning that into reasonably efficient code are handled by bamboo and RDataFrame.
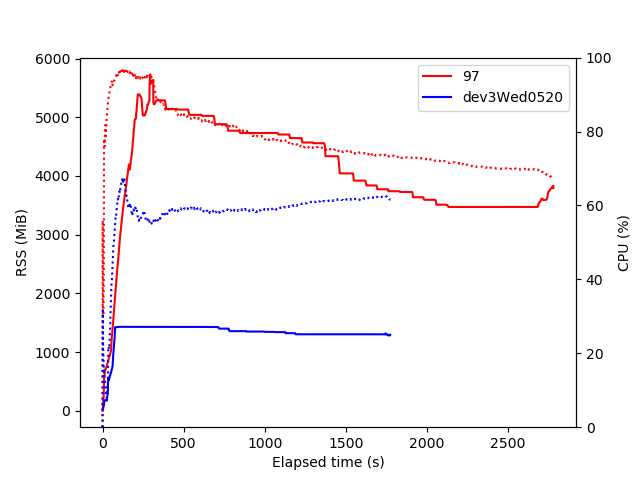
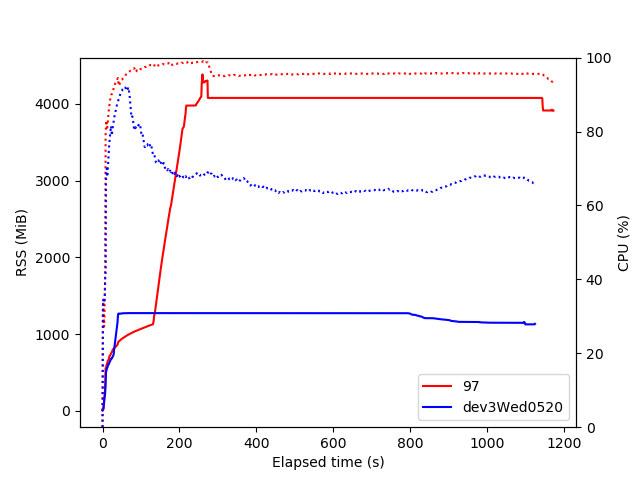
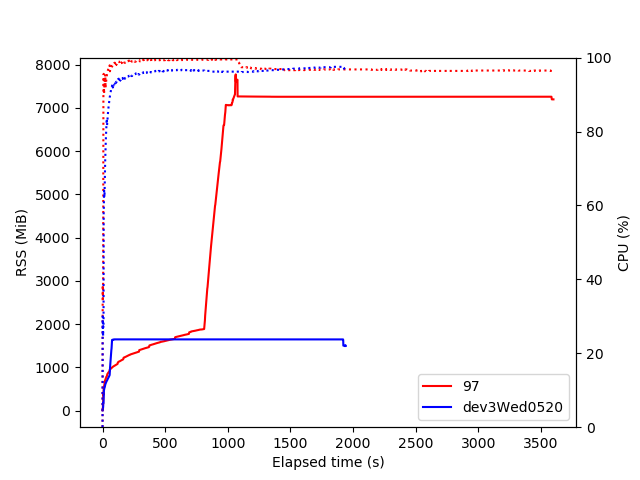
The main limitation for now is that we should not produce too many plots at once to keep memory usage under control (see RDataFrame+cling memory usage), but the performance and flexibility are sufficient for this to be used in several CMS analyses (five now, I think) - so many thanks to the ROOT team for the underlying framework. If I can help improve things by running some tests or benchmarks on these types of graphs I’ll be happy to do so.

Thanks,
Pieter

2 Likes

Nice!

Regarding

We have something in the pipeline! :slight_smile:

Sure, bench the hell out of it! Best would be realistic workflows, so if the analyses that are using it can hand in a mock use case, that would be very interesting.

Congratulations @pieterdavid!

We have something in the pipeline!

Even better, we have something in master, and in the upcoming v6.22! You should see performance improvements and reduced memory usage when switching versions.

Something else that might be of interest to you is a new facility to turn relatively simple python expressions into C++ callables via numba: ROOT: tutorials/pyroot/pyroot004_NumbaDeclare.py File Reference

Incidentally: how does bamboo turn python expressions/lambdas/callables into C++ expressions at the moment?

Cheers,
Enrico

Thanks @StephanH and @eguiraud ! I will try with the master branch and let you know how it compares.

The event view (tree in the example above) is a proxy object that uses operator overloading etc. to build up a python object representation of the expression, and this one has a method to convert to a C++ string. If the expression is simple that is used directly, otherwise it is split in a helper function that is passed to gInterpreter.Declare, and called by the code in the Filter or Define nodes, with the appropriate columns as inputs (as an example of each: tree.Jet[0].pt returns a FloatProxy(GetItem(GetArrayColumn('Float_t', 'Jet_pt', GetColumn('UInt_t', 'nJet')), 'Float_t', Const('std::size_t', 0)), 'Float_t'), which converts to Jet_pt[0], while op.select(tree.Jet, lambda j : j.pt > 30.) would make a Select node with a reference to the input collection and the predicate expression corresponding to Jet_pt[i] > 30., and generate a function that calls essentially std::copy_if on the range [0-nJet) with that in a lambda).

Wow, that’s amazing. That means that you get compiled-C++ performance on a python lambda. :fire:
It would be cool to have something that can get around the copy_if if that’s needed often.
@eguiraud could that work with an RVec mask?

Indeed with some extra book-keeping on bamboo’s part it would be possible to Define a new column that just contains the indexes of the interesting entries rather than copying the interesting entries to a new vector. Which is best depends on the application.

Nice, thanks! We made two main improvements, plus a few minor ones:

  1. a lot of redundant compilation work has been removed for RDF expressions that result in basically the same C++ function, e.g. Filter("x > 0") and Filter("y > 0") now result in a single [] (double x) { return x > 0; } being compiled. That saves up a lot of startup time in large analyses where many cuts are similar (but might be applied to different branches).
  2. different RDF computation graphs now share the interpreted code, so if your application does similar things on different datasets you reuse the same interpreted functions (as in 1.) and if you can “prepare” the different RDF computation graphs before any of them runs an event loop, we make a single call to the interpreter instead of one per RDF computation graph, which is potentially a big gain if you have dozens of computation graphs in flight

Since you have your own way to generate C++ code from python expressions, the new feature I shared might not be very useful. Nonetheless, bamboo is a very interesting stress-test of RDF usage from python. We would be interested in helping out with any performance bottlenecks you might see.

Cheers,
Enrico

Indeed :slight_smile: . There are some limitations to what can be in the python lambda, but it’s enough to make the code look quite natural already for most things.

The copy_if is on the list of indices already (the other branches are captured in the predicate lambda), I’m sorry for not being clearer on that (the book-keeping was a fun exercise indeed).

I ran some tests with workflows from my own and two colleagues’ analyses, and the improvement both in memory usage and the time needed to build up the RDataFrame graph are spectacular. The time of the event loop also seems faster, but that’s a bit more difficult to estimate from a single run. Below are the plots of RSS memory (from parsing the output of ps -u) versus time for the three cases (the dotted line is CPU utilisation, since I had the impression that IO from EOS was also playing a role; I processed a single file here, typically we have a few per batch job). The first case is not very heavy on histograms, but compares different jet selections, so there are quite some Define nodes. The third one is filling about 15000 histograms (due to systematics variations - 10min to build up the graph seems still very long for that, but I haven’t look in detail at the code yet) - in any case the picture is quite similar, and between a factor of three and five of reduction in peak memory usage is really a big difference, thanks a lot! Looking forward to the next release :slight_smile:

Thanks,
Pieter

ttWcontrolPUID_trends HHbenchmark_trends ZA17_trends

Some more details on the environment:
source /cvmfs/sft.cern.ch/lcg/views/dev3python3/Wed/x86_64-centos7-gcc8-opt/setup.sh versus source /cvmfs/sft.cern.ch/lcg/views/LCG_97python3/x86_64-centos7-gcc9-opt/setup.sh (ROOT 6.20/02) on a CentOS7 lxplus node (lxplus775).

1 Like