Background subtraction from spectrum

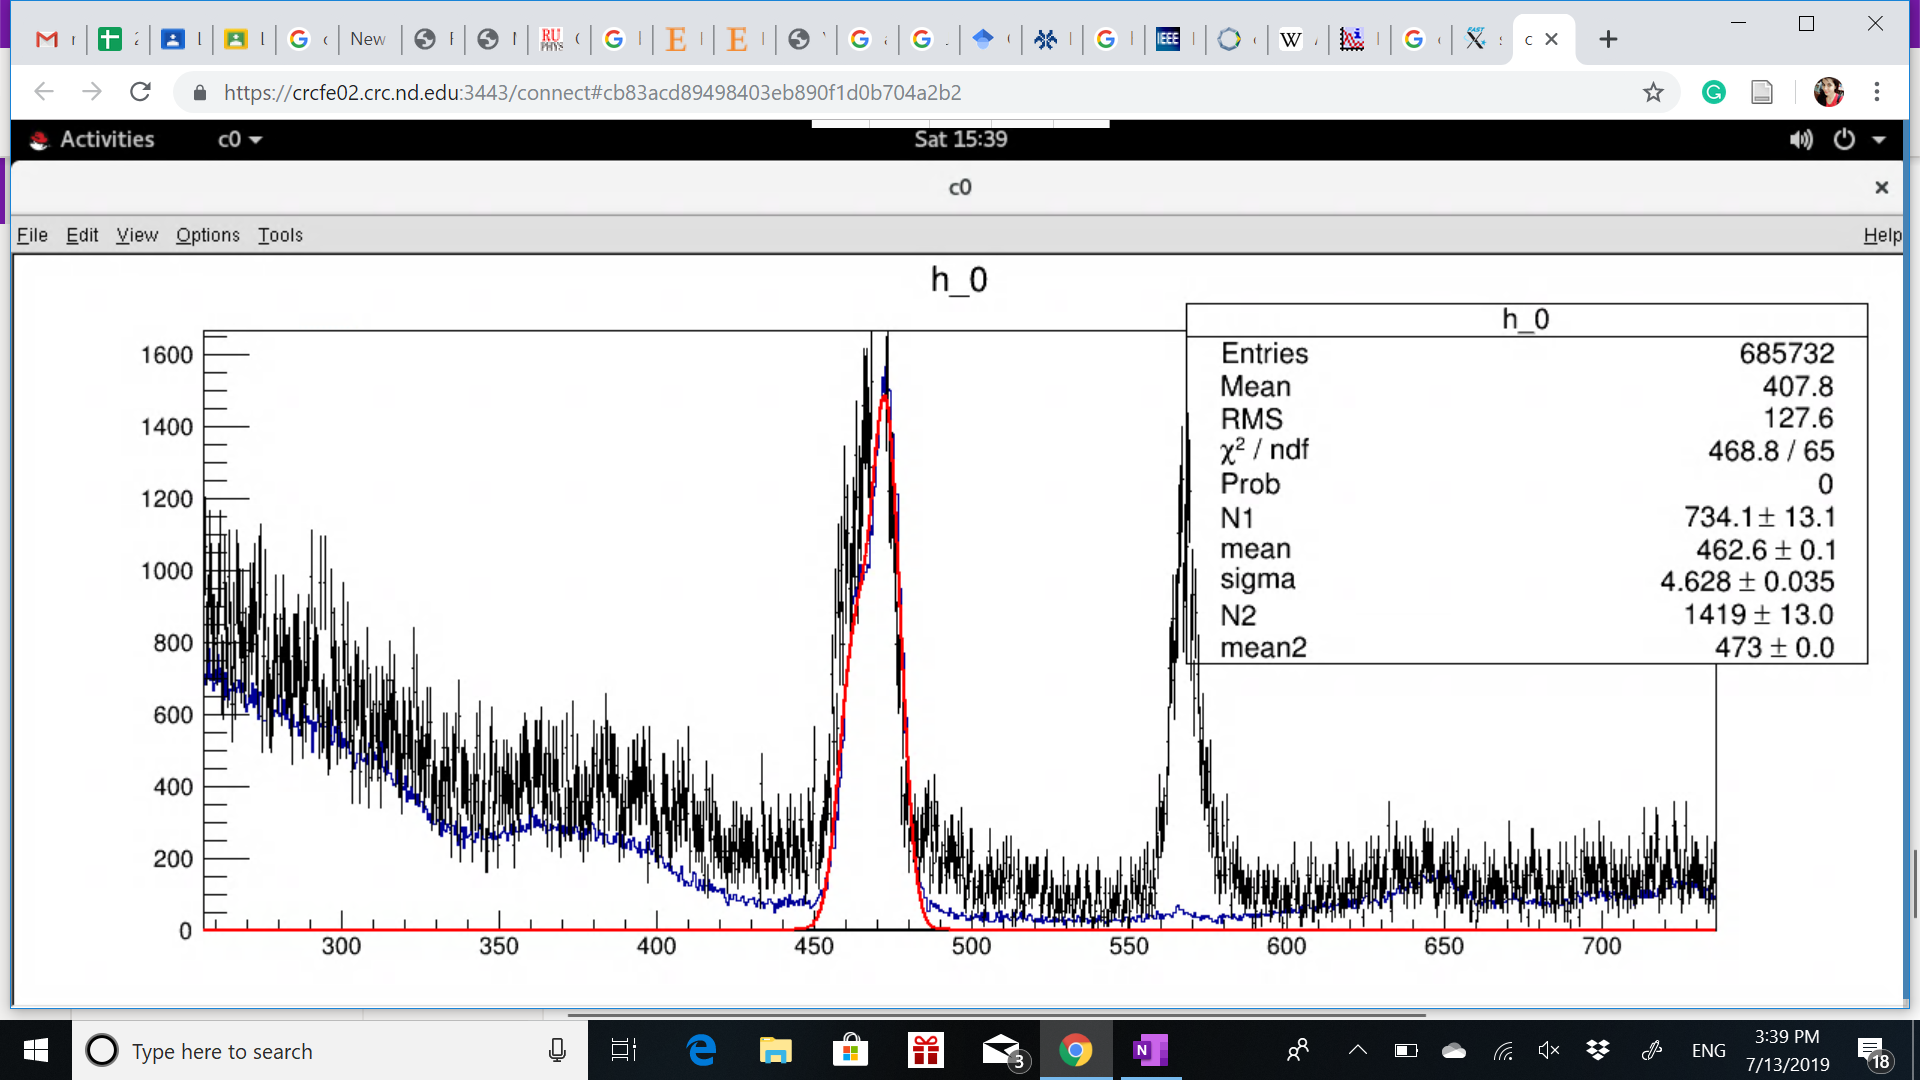
I need to subtract the background blue in color from my spectrum (Black) and need to plot the energy calibrated histograms for each run. Then need to calculate the area under the peak of interest(which is between channel 550 and 600).

Also, how to take into account drifting from run to run?
Can someone help me in writing the automated code for this? There are over 200 root files.
Thanks.

Hi and welcome!

So, do you have the blue and the black as histograms? The, you can subtract them doing:

h_0.Add(h_1, -1.0)

Then, h_0 contains the difference of h_0 to h_1.

Regarding the automated code: I assume you want to have a loop over all ROOT files and do the same analysis for each of them? Could you specify more precisely what you want to do there?

Best
Stefan