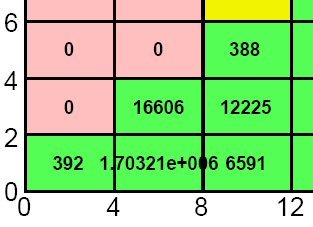
I’m trying to figure out how to control the formatting on the numbers generated using TH2D::Draw(“text”). When the value of the individual cell goes to 1,000,000 the text switches to scientific notation. I would like to control that change and control the number of significant figures when it does change. Any guidance?
See attached screen shot for example.
Thanks,
Chris