AttributeError: 'TGraphErrors' object has no attribute 'Divide'

Im writing script using pyroot to make ratio plot, script is in attachment
plotSeveralScaleFactors_new.py (6.0 KB)
I got the error like:
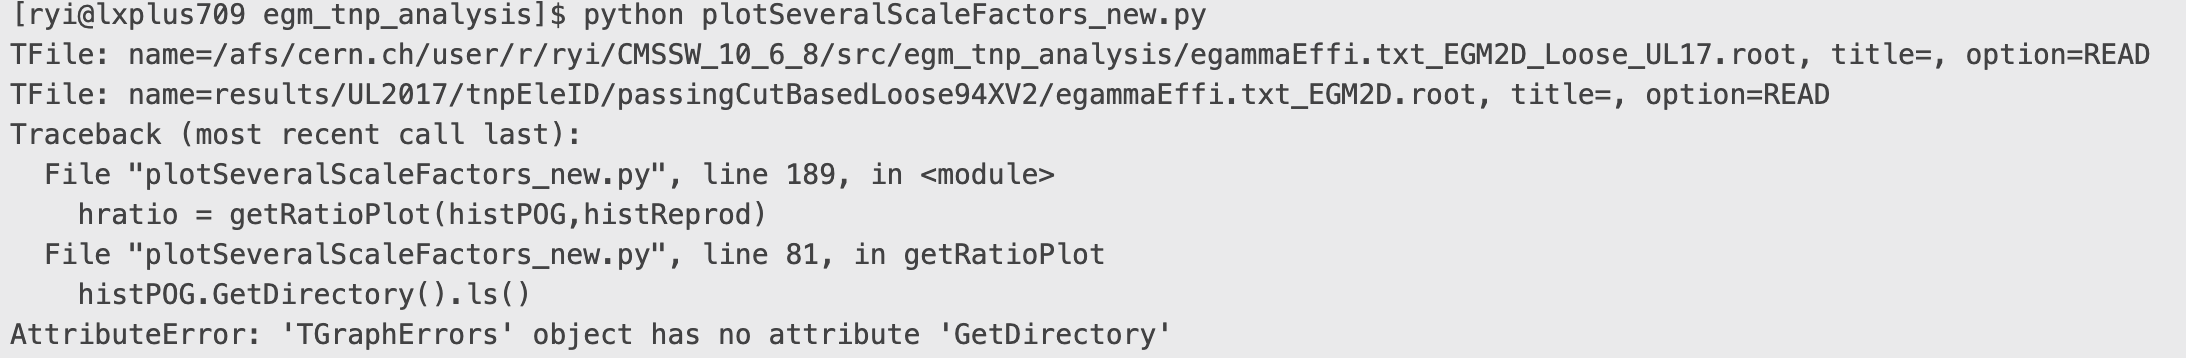
Traceback (most recent call last):
File “plotSeveralScaleFactors_new.py”, line 188, in
hratio = getRatioPlot(histPOG,histReprod)
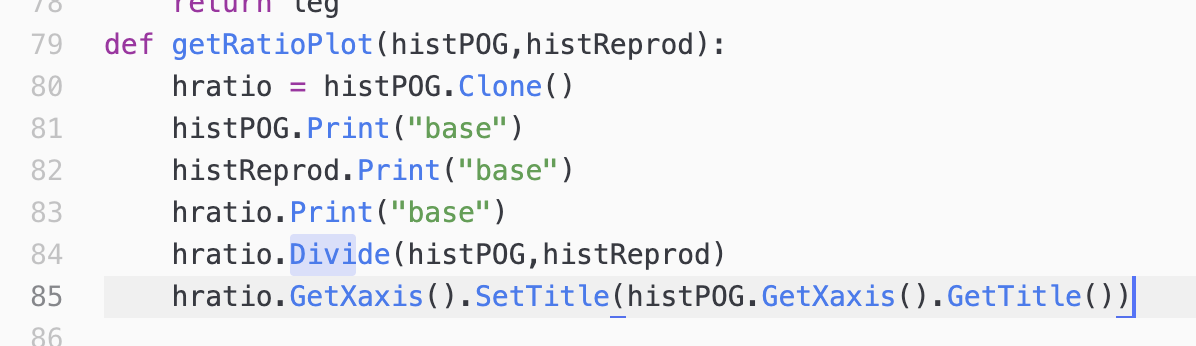
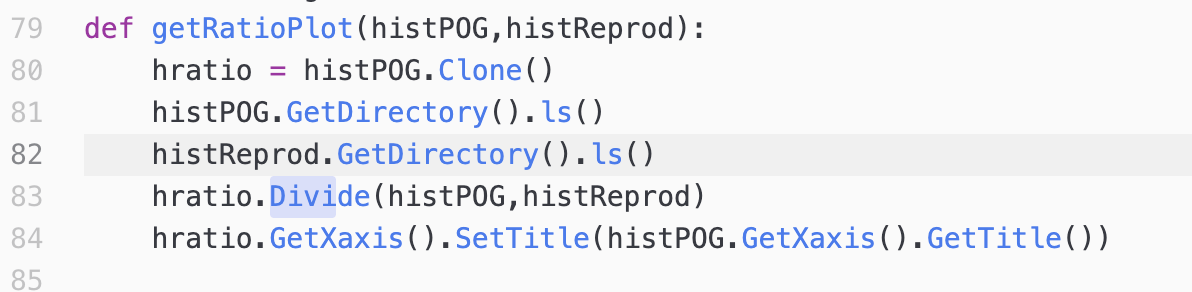
File “plotSeveralScaleFactors_new.py”, line 82, in getRatioPlot
hratio.Divide(histPOG,histReprod)
AttributeError: ‘TGraphErrors’ object has no attribute ‘Divide’

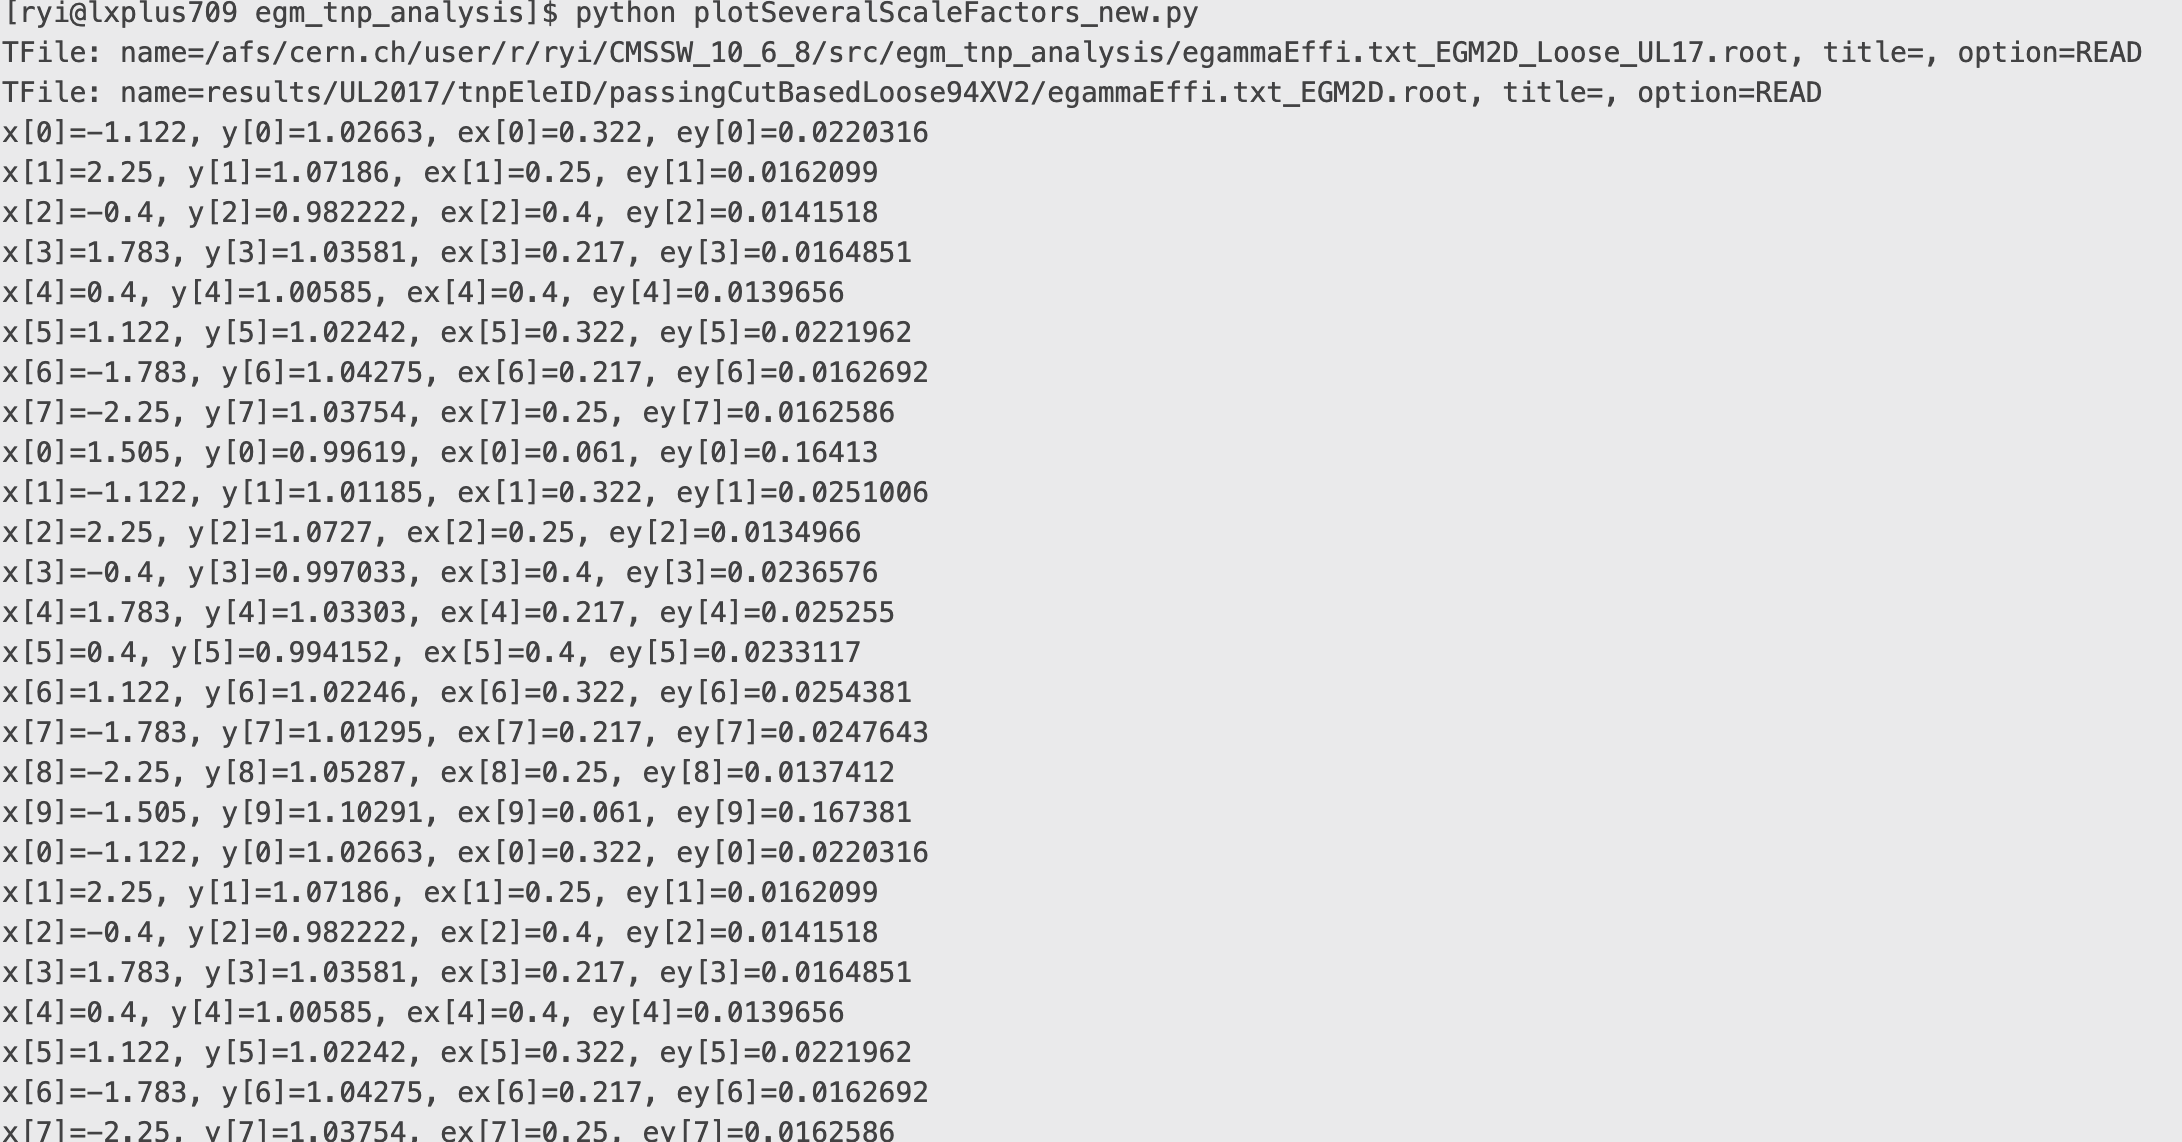
I’m confused because i checked the input histogram, it does have TGraphErrors:
x[0]=1.505, y[0]=1.01493, ex[0]=0.061, ey[0]=0.146021
x[1]=-1.122, y[1]=1.00614, ex[1]=0.322, ey[1]=0.025992
x[2]=2.25, y[2]=1.01912, ex[2]=0.25, ey[2]=0.0157703
x[3]=-0.4, y[3]=0.986175, ex[3]=0.4, ey[3]=0.0256119
x[4]=1.783, y[4]=1.01436, ex[4]=0.217, ey[4]=0.0161215
x[5]=0.4, y[5]=0.987915, ex[5]=0.4, ey[5]=0.0251863
x[6]=1.122, y[6]=1.00307, ex[6]=0.322, ey[6]=0.0259551
x[7]=-1.783, y[7]=1.02682, ex[7]=0.217, ey[7]=0.0157715
x[8]=-2.25, y[8]=1.03863, ex[8]=0.25, ey[8]=0.016025
x[9]=-1.505, y[9]=1.14019, ex[9]=0.061, ey[9]=0.146399

idk why i get this AttributeError? thanks a lot

Check your input files. You need to work with histograms, not graphs.

thanks for the reply. I checked my input files, they are histograms. i don’t know why the attributeerror then :disappointed_relieved:

Right before the “Divide” line, what do you get from:

histPOG.Print("base")
histReprod.Print("base")
hratio.Print("base")

and:

histPOG.GetDirectory().ls()
histReprod.GetDirectory().ls()

from
histPOG.Print(“base”)
histReprod.Print(“base”)
hratio.Print(“base”)
I got:


from
histPOG.GetDirectory().ls()
histReprod.GetDirectory().ls()
I got


As you can see (e.g., from the “Print” outputs, the “GetDirectory” errors, and also the “Divide” error), “histPOG”, “histReprod” and “hratio” are graphs, NOT histograms.

You can “list” the contents of “your_file.root” using:
rootls -l your_file.root
or:
root -b -q -l your_file.root -e 'gFile->ls();'

ah thank you, I got it, they are indeed graphs. is there anyway to get ratio plot from graph, or do I need to convert them to histograms first?

You need to talk to your colleagues and/or your supervisor to decide what makes sense in case of your data.

thank you, if to make ratio plot from graphs, is there any ways to do it? I didnt find it on pyroot tutorial so a little confused…

This topic was automatically closed 14 days after the last reply. New replies are no longer allowed.