Hi Bertrand,
In fact I did need the reminder about JSROOT … beautiful examples!
Could you give more details?
Sure, first I’ll mention that around 2006 I developed an OpenSceneGraph (OGL) driver for Geant4 which never made it into widespread use, but provided trackball interactivity of models and events that the standard drivers did not have. I’m also familiar with Cernlib since 1995. I’ve had it in-mind to build this HistoScope remake for years, but held-off until I had a good way to do the 3d widgets.
I call my app “d3plot”. One of my goals was to import only d3js, no jquery or three.js. I had considered using three.js back in the brainstorming stages, but my effort was only launched when I bothered to work out the 3d stuff without any libs … hence my plots don’t have perspective.
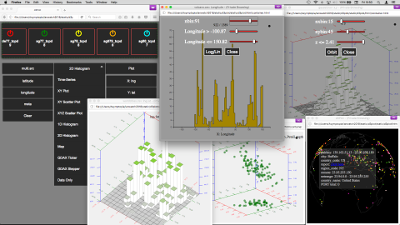
In d3plot there is never anything to type … everything is by buttons and sliders. Unless you want to monitor over-the-network, then one needs to edit a “.src” file with the url and expected fields. In the remote-monitoring case it can receive from an arbitrary number of sources … not sure if that’s useful for physics, but this aspect is for studying network attacks across several nodes. In the screenshot, the colored icons across the top are “source” objects receiving data from a Python daemon on the other end, over websockets.
To the original widget set I’ve added a map, and have plans for a timeline widget. There is a time-series widget already. My current widgets are: t-series, h1d, h2d, scat2d, scat3d, xy-plot and map. In the map I’ve added an extra field called “meta”, which provides a way to get more than just lat/lon to the map … I send a whole webpage in .meta, with links to reports and so-forth.
It aims to offer all the functionality of HistoScope, draggable axes, interactive cuts via sliders, rebin sliders, log/lin axes, and such. Next I’m working on a “line styles” widget … currently the yellow fill in the screenshot was hard-coded just for the screenshot. But that’s coming.
Another feature: all widgets are self-contained and have their own built-in demo mode in case of no data source. The histograms build-up sampled Gaussians, the xy draws Lissajous figures and the map plots a list of cities, etc. Similar to JSROOT, the API just requires that you pass it a
to render to. To make them separable each widget needs its own window. To get the data to that detached window I write to window.sessionStorage, or in the case of a websocket Source then the Source (part of parent app) has a pointer to the window and calls window.widget.receive().
I think we could mutually benefit from each other
That would be great – I would like to collaborate and contribute. d3plot’s interface is simple enough that it could be used in schools … I feel that it is very instructive to be able to see the same data represented different ways. I think an educational scavenger hunt could be possible, for example, where student provided data set, then required to cut-away various “noise” to get at the desired data. Things like that.
Finally: my motivation? I earned my PhD in phys in 2004 … since 2012 I’ve drifted away into software land. I undertook this in order to get myself back into science, the Histo-Scope app being some of the most useful software I’ve known and it still doesn’t seem to exist with this kind of interface.
Could you comment on the future roadmap for JSROOT? I hope we will be able to collaborate!
Cheers,
-Charles
[1] Root's GUI and Visualization of Histograms & Ntuples
[2] http://lss.fnal.gov/archive/1992/conf/Conf-92-259.pdf