hi dear experts,
i am trying to plot multiple graphs on the same canvas by using the ‘same’ option.
all of the graphs are plotted and shown as well as i wanted except one. it is because of its data range
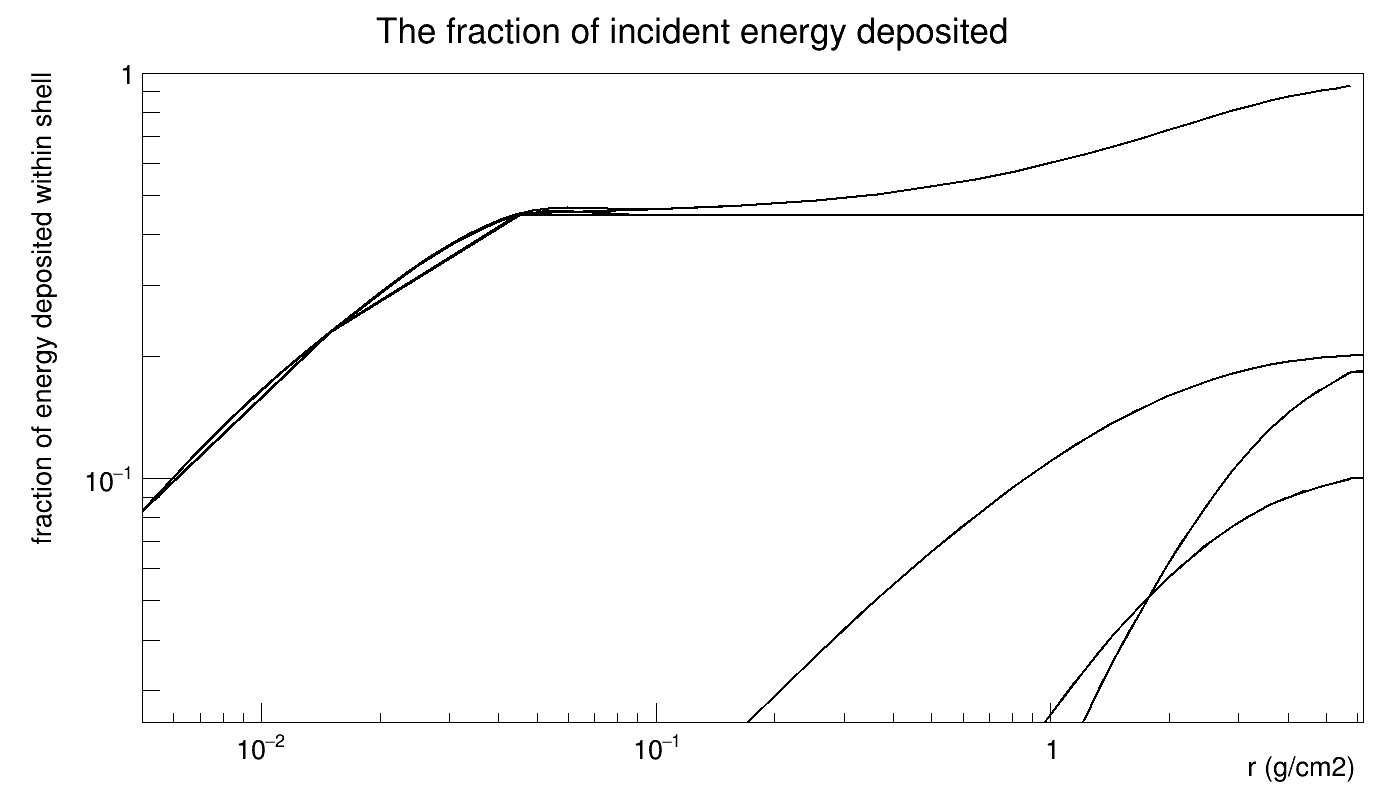
there is another graph that is not showed. (its highest value is a little over 1e-3)
is there any method to plot all of them?
i attached my .root file and plot code .
many thanks,
result.root (48.5 KB)
plot.c (3.2 KB)