I can think of a few workarounds (e.g. just plotting multiple histograms), however I’m wondering if there’s a more straight-forward way to add “gaps” between certain bins of a single 1D histogram.
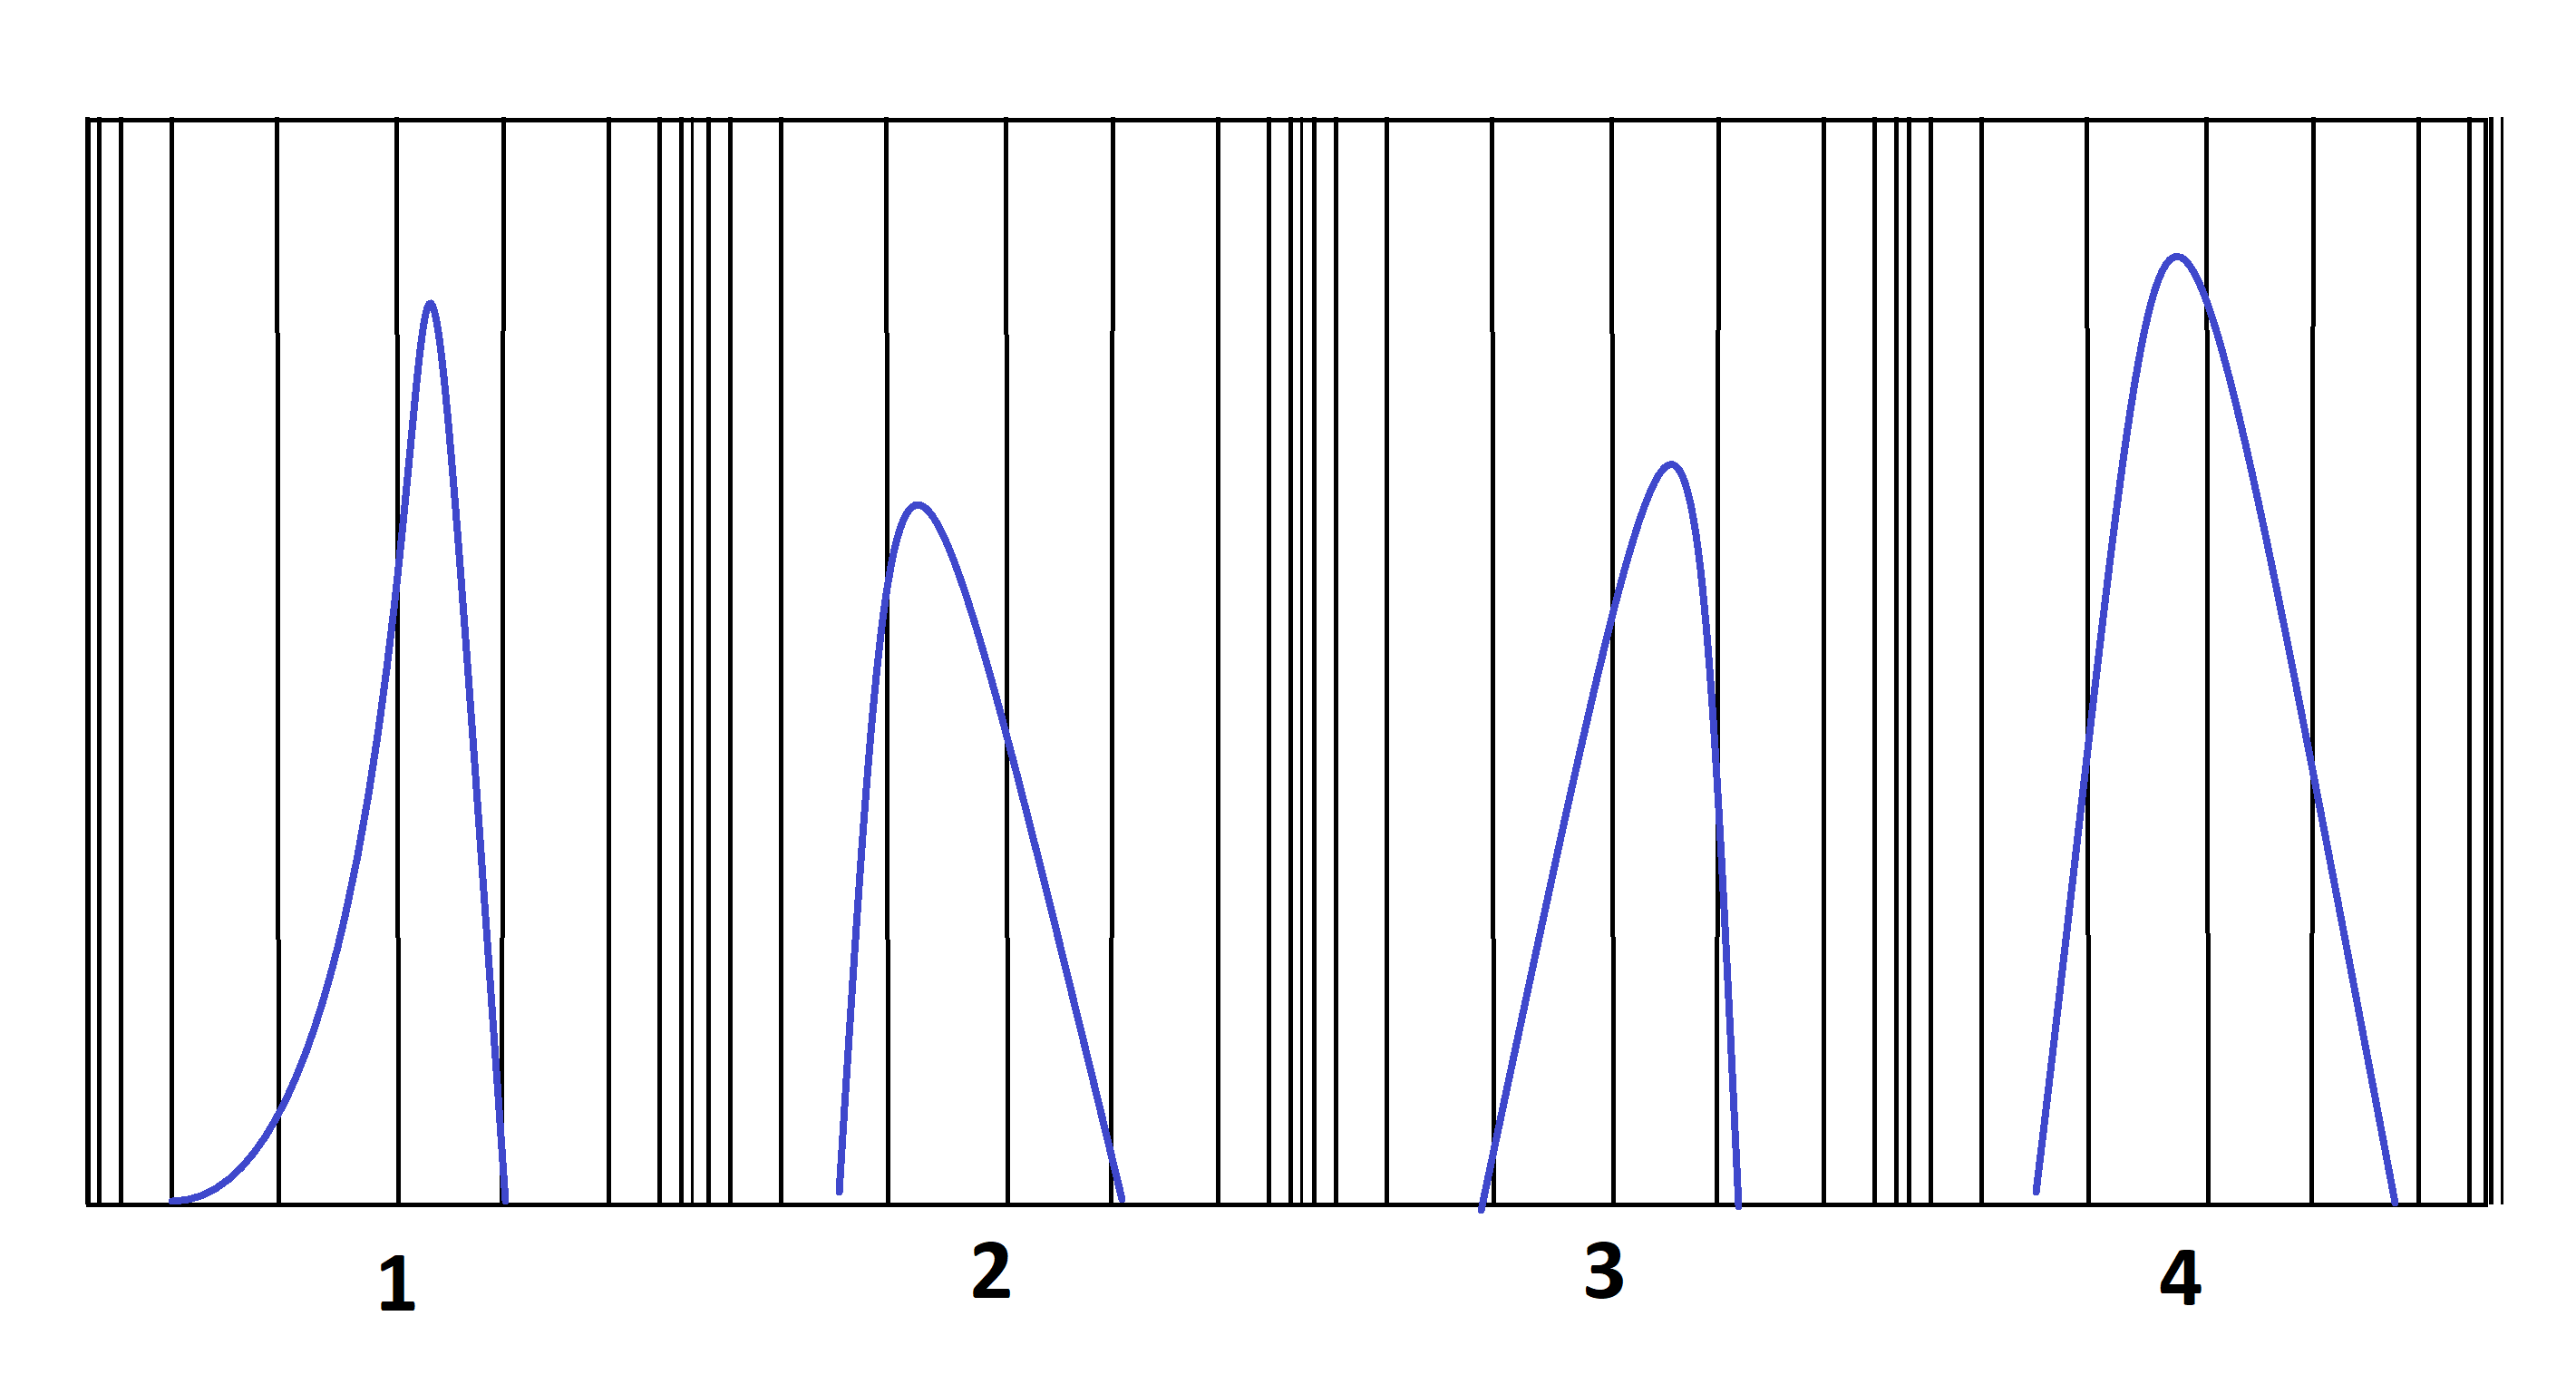
For example, you can imagine a histogram with counts “clustered” at integer intervals (e.g. narrow Gaussians centered at 1, 2, 3, …). I may want to plot only the ranges 0.75 - 1.25, 1.75 - 2.25, 2.75 - 3.25, etc.
Something like this crude sketch: