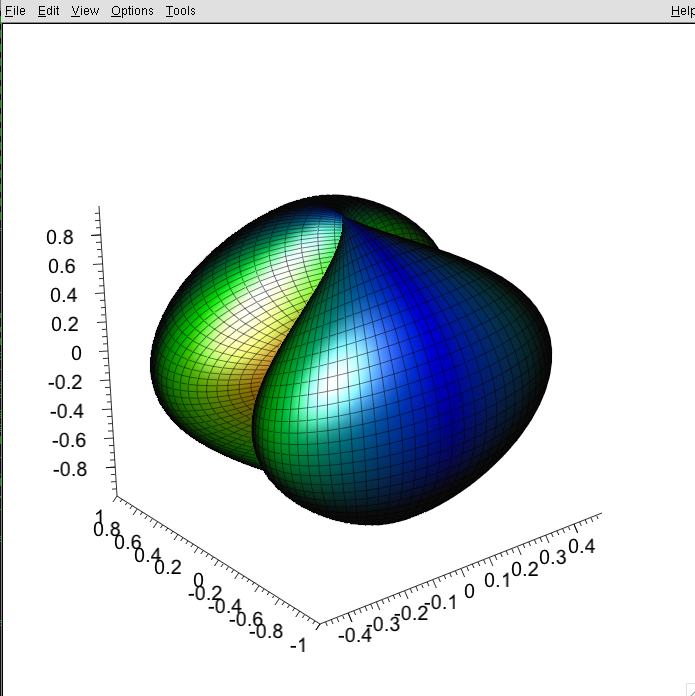
I’ve recently (today) found TGLParametricEquation. Very nice. My small question is if there is a simple way
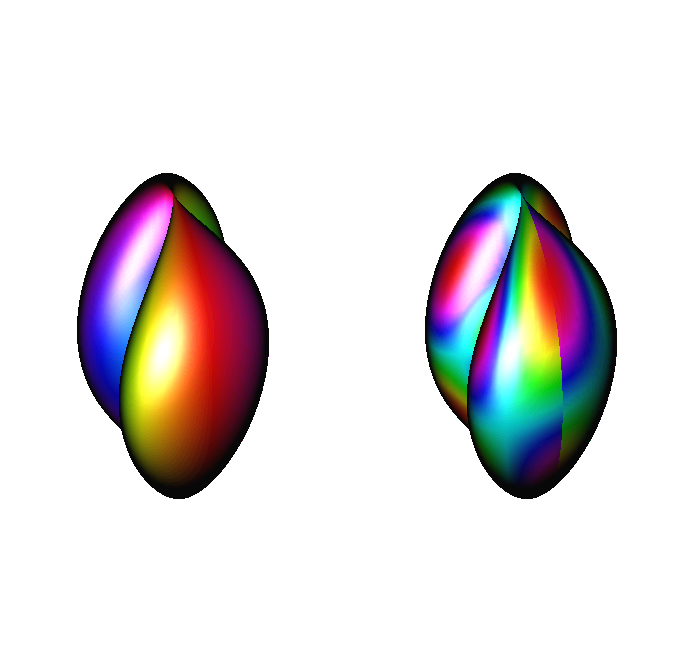
to add axes and a “color code” to a plot? I hope the images I include says more than my 100 words…
I also include the very short script needed to reproduce the unmodified figure
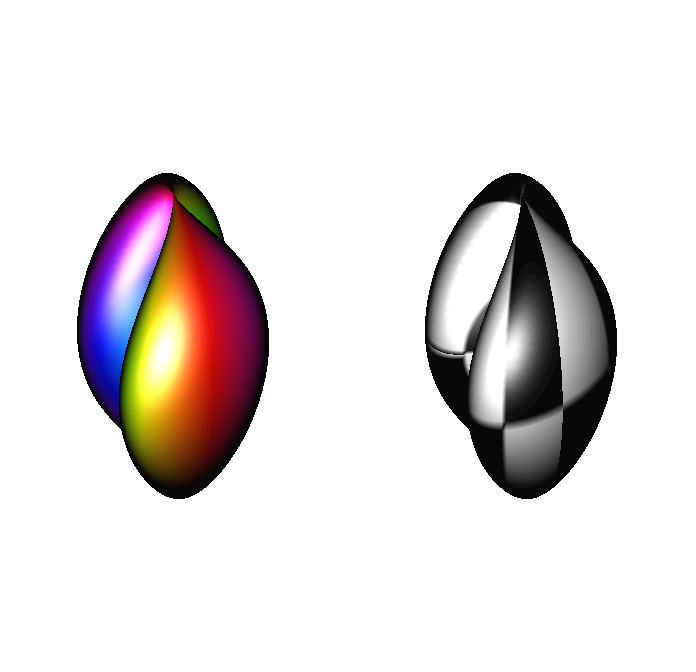
I think, I can add axes, but color palette is not interesting for you, since I calculate color not from your data, but from surface normals (there are several color schemes, which you can change by pressing ‘s’ or ‘S’ - this was done because I like such colored surfaces )
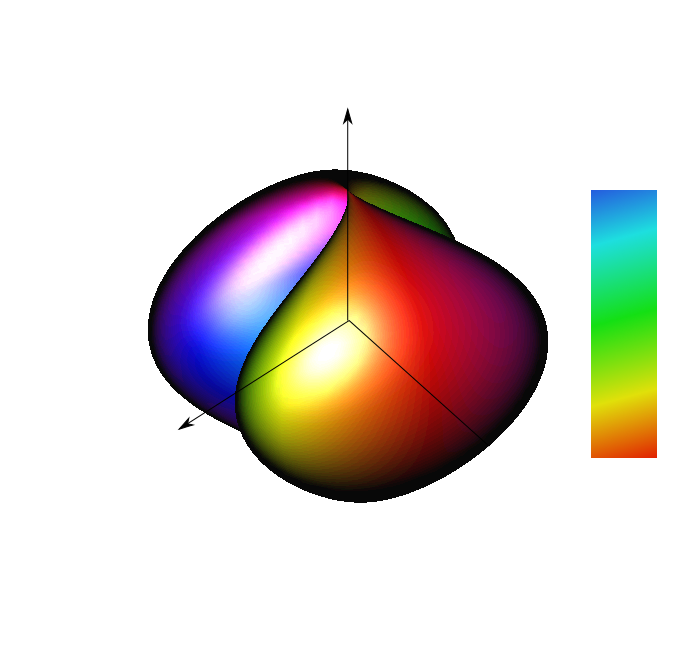
as for the palette, I didn’t really thinking… What I want to plot is the Phi component of field as a function of the r (spherical coordinates). The distance to origin in my plot is of course the magnitude of the Phi component, but it would be nice to color code the sign (i.e. two colors). That is, if it is parallel or anti parallel with the Phi basis vector. This would of course require an additional function. Or I’m just not thinking again…
as for the palette, I didn’t really thinking… What I want to plot is the Phi component of field as a function of the r (spherical coordinates). The distance to origin in my plot is of course the magnitude of the Phi component, but it would be nice to color code the sign (i.e. two colors). That is, if it is parallel or anti parallel with the Phi basis vector. This would of course require an additional function. Or I’m just not thinking again…
cheers
Joa[/quote]
Can you, please, give your equations? And also describe how you want to select the color, according to this equation. I’ll try to make a generic solution for user-defined color palette.

 )
)