Hello, I analyzed data for muon production in electron positron annihilation
by this fit
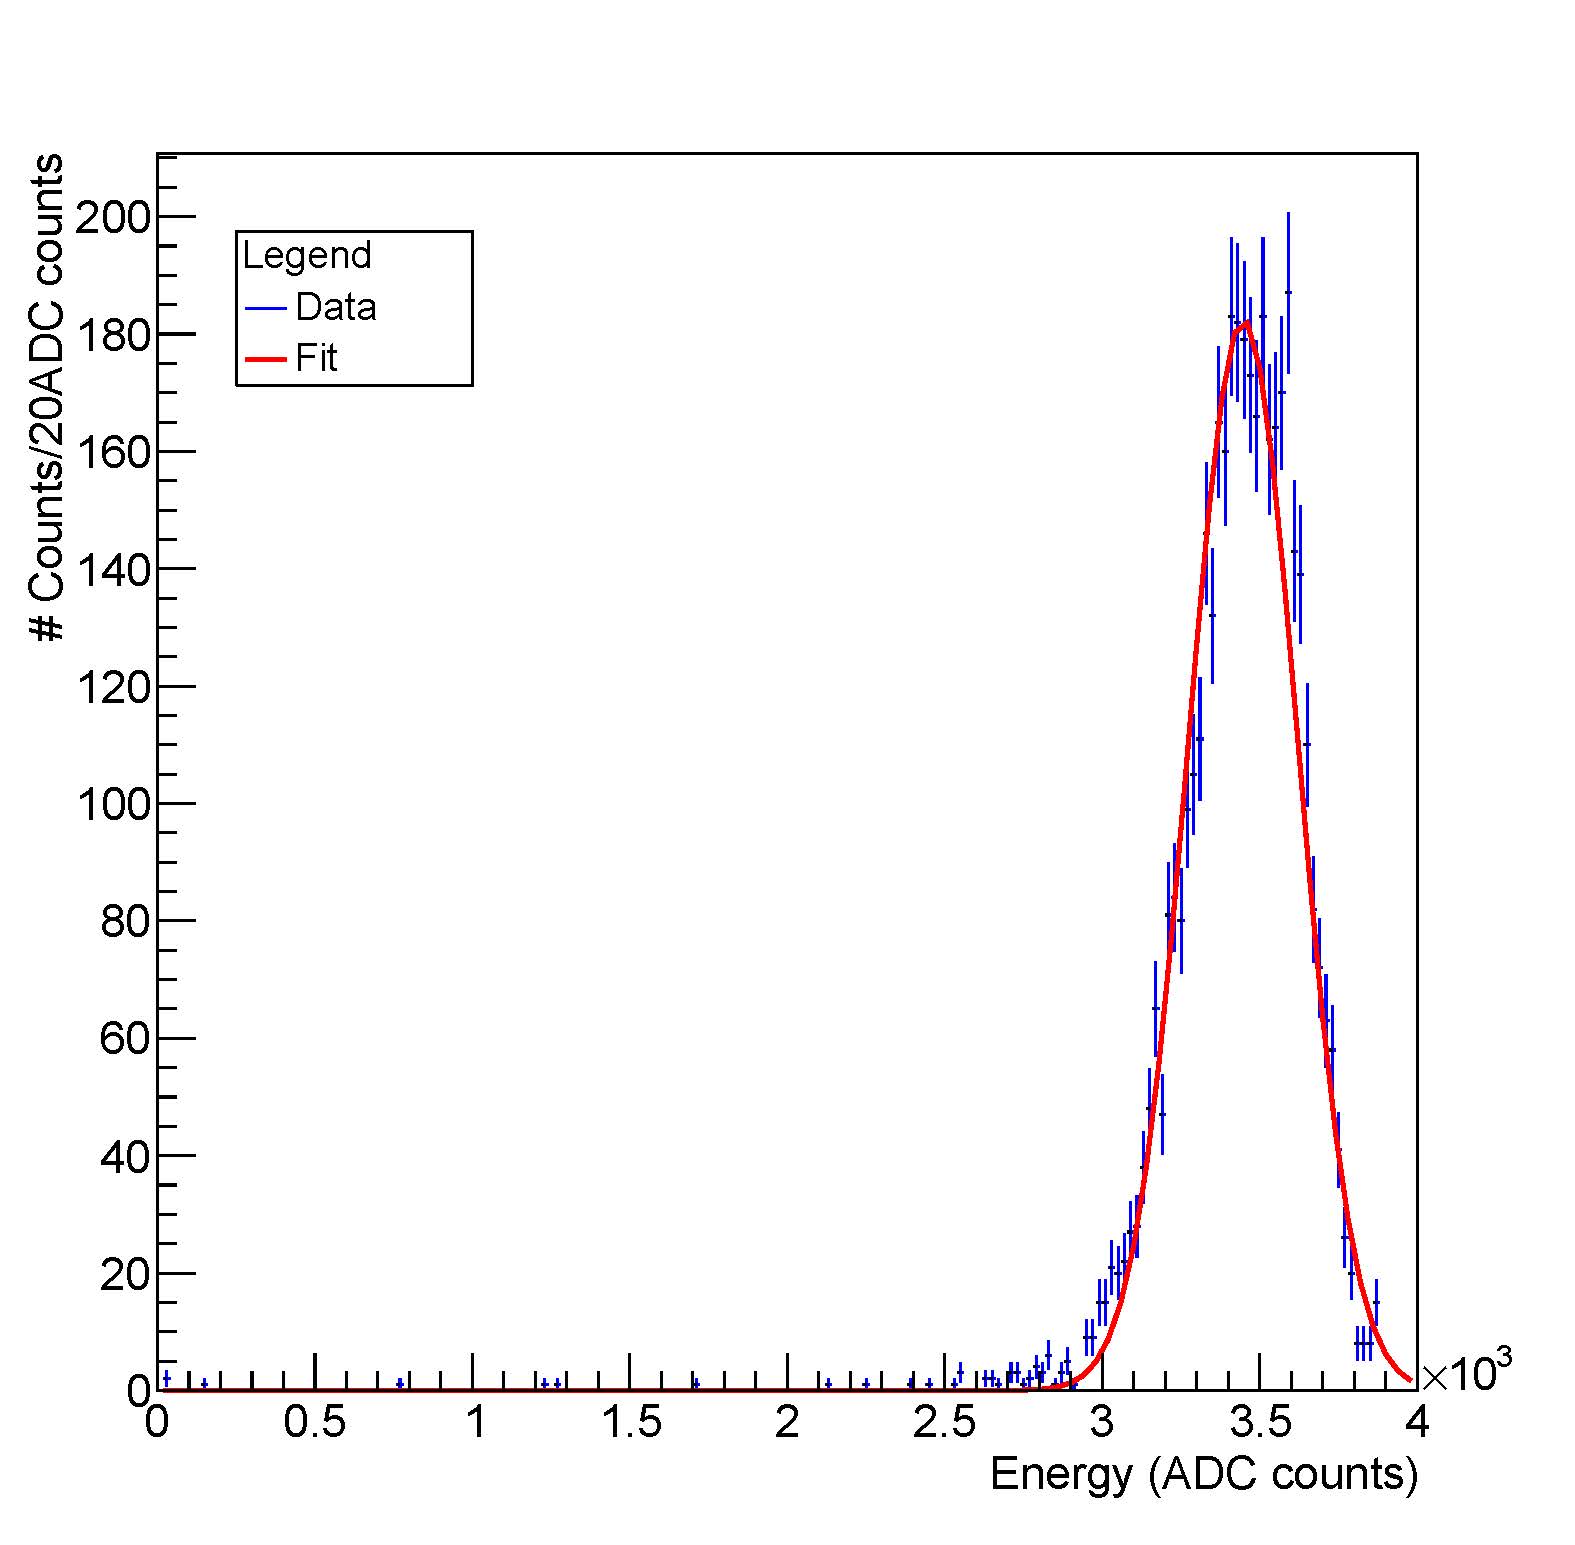
I got the corrispondence 1GeV= (156.7 +/- 7.9) ADC
Then, I’ve now to change the scale of this plot
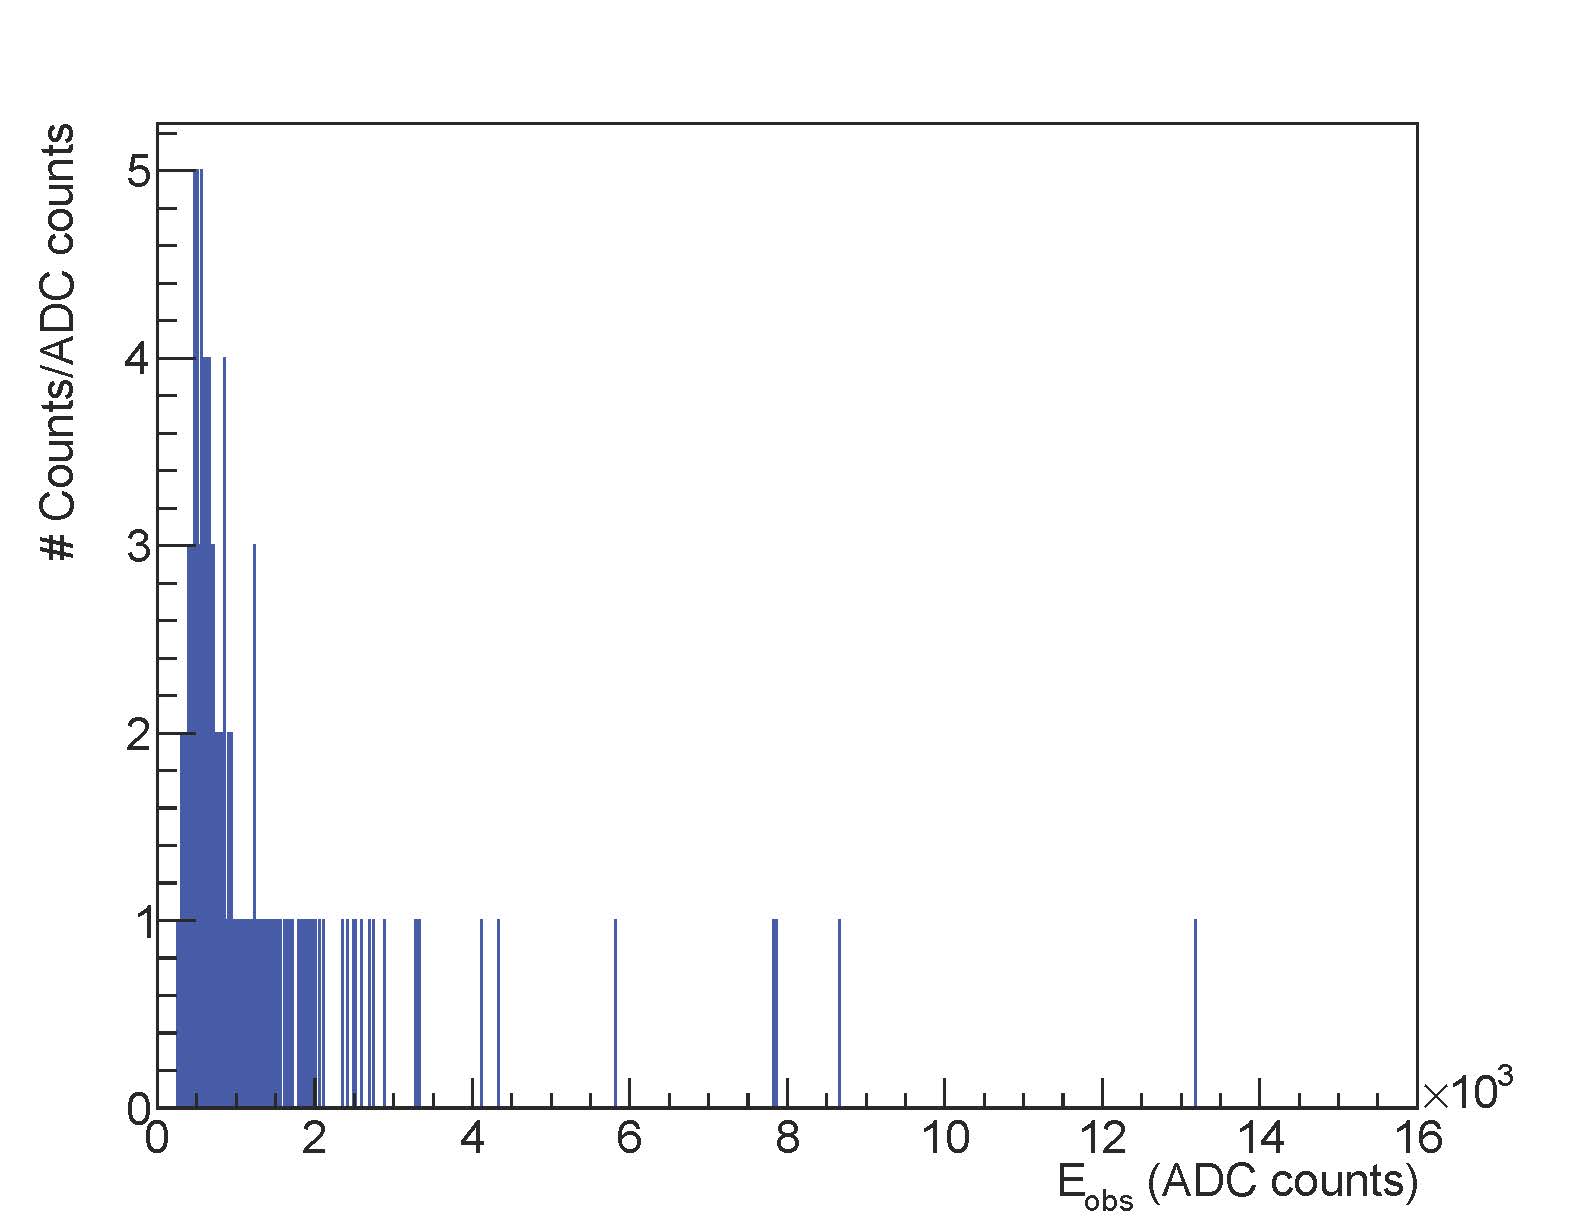
from ADC to GeV
but data are stored in this root file https://we.tl/t-AOGTwTgDkX
how can I rescale the x-axis from ADC counts to GeV?
Here is the macro
caloeff.cpp (232.0 KB)
and this plot is made here (lines 4217- 4283)
	TCanvas *c92 = new TCanvas("c32",canvtitle,1280,1024);
 			t->SetLineColor(kBlue);
 			TCut cutsubdet = TString::Format("subdet==%d ", subdetnumb).Data();
 			TCut cutxhmin = TString::Format("xh>%d ", xhmin).Data();
 			TCut cutxhmax = TString::Format("xh<%d ", xhmax).Data();
 			TString heneossstring = TString::Format("Calo_EnDep[%d] + Calo_EnDep[%d] + Calo_EnDep[%d]  + Calo_EnDep[%d] + Calo_EnDep[%d] >> htemp(16000., 0., 16000.)", b,d,e,f,g);
			t->Draw(heneossstring, cut && !cut3sub && !cut3sub2 && cuteneb && cut4sub && cut5sub && cut6sub && cut7sub && cut8sub &&cutsubdet && cutxhmin && cutxhmax);
			gPad->Modified();
			gPad->Update(); // make sure it's really (re)drawn
			t->GetHistogram()->SetTitle(cdenenameoss);
 		   TH1F *heneoss = (TH1F*)gPad->GetPrimitive("htemp");
 		   heneoss->SetStats(0);
 		/*	TF1 *gosssub = new TF1 ("mosssub", "gaus", 1000, 3000);
  			gosssub->SetLineColor(kYellow);
  			TF1 *gosssub = new TF1 ("mosssub", "gaus", 2000, 16000);
  			gosssub->SetLineColor(kGreen);
  			TF1 *fosssub = new TF1("gaussexpo", "gaus(0) + gaus(3)", 0, 4000);
  			fosssub->SetParNames("Constant 1", "Mean 1", "Sigma 1", "Constant 2", "Mean 2", "Sigma 2");
  			fosssub->SetLineColor(kRed);
			heneoss->Fit(gosssub, "R");
  			heneoss->Fit(gosssub, "R");
  			Double_t parosssub[6];
  			gosssub->GetParameters(&parosssub[0]);
  			gosssub->GetParameters(&parosssub[3]);
  			fosssub->SetParameters(parosssub);
  			heneoss->Fit(fosssub, "R");
  		    heneoss->Draw("e1");
  			gosssub->Draw("SAME");
  			gosssub->Draw("SAME");
  			fosssub->Draw("SAME");
  			posssub=fosssub->GetParameter(1);
  			posssub=fosssub->GetParameter(2);
		*/	//heneoss->GetXaxis()->SetTitle(cdeneXnameab);
			heneoss->GetXaxis()->SetTitle("E_{obs} (ADC counts)");
			heneoss->GetYaxis()->SetTitle(cdeneYnameab);
			heneoss->GetYaxis()->SetTitleSize(c2_YTitleSize);
			heneoss->GetYaxis()->SetTitleFont(c2_YTitleFont);
			heneoss->GetYaxis()->SetTitleOffset(c2_YTitleOffset);
			heneoss->GetYaxis()->SetLabelFont(c2_YLabelFont);
			heneoss->GetYaxis()->SetLabelSize(c2_YLabelSize);
			heneoss->GetXaxis()->SetTitleSize(c2_XTitleSize);
			heneoss->GetXaxis()->SetTitleFont(c2_XTitleFont);
			heneoss->GetXaxis()->SetTitleOffset(c2_XTitleOffset);
			heneoss->GetXaxis()->SetLabelFont(c2_XLabelFont);
			heneoss->GetXaxis()->SetLabelSize(c2_XLabelSize);
			heneoss->SetFillColorAlpha(kBlue, heneabfillcolor);
			heneoss->Draw();
			heneoss->SetName(heneabname);
   			gPad->Modified();
			gPad->Update(); // make sure it's really (re)drawn
   		/*	TLegend* legeneoss = new TLegend(0.15, 0.85, .25, .75);
   			legeneoss->SetHeader("Legend");
			legeneoss->SetNColumns(1);
			legeneoss->AddEntry(heneoss, "Data", "l");
			//legeneoss->AddEntry(fosssub, "Fit", "l");  //TO USE FOR 2 GAUSSIAN FIT
			legeneoss->Draw(); */
			gPad->Update();
			/*TPaveStats *statsgeneoss = (TPaveStats*)heneoss->GetListOfFunctions()->FindObject("stats");
			statsgeneoss->SetTextColor(kBlue);
			statsgeneoss->SetX1NDC(0.80); statsgeneoss->SetX2NDC(0.98);
			statsgeneoss->SetY1NDC(0.77); statsgeneoss->SetY2NDC(0.92);
			//statsgeneoss->AddText(TString::Format("Mean = %g", posssub));
			//statsgeneoss->AddText(TString::Format("Sigma	= %g", posssub));
			//statsgeneoss->DrawClone();
			gPad->Update();*/
			c92->Print(myploteneoutoss);
			delete c92;
Please read tips for efficient and successful posting and posting code
ROOT Version: Not Provided
Platform: Not Provided
Compiler: Not Provided