About TH2D Projection

Hi, rooters,
A TH2D have generated called h2(see my macro). And I want to get a TH1D which represents the mean of Y via per X bin.

using namespace std;
void example()
{

        TH2D *h2 = new TH2D("h2","h2",10,0,10,10,0,10);
		h2->Fill(2.3,3.4);
		h2->Fill(2.3,3.1);
		h2->Fill(2.9,2.1);
		h2->Fill(4.1,7.9);
		h2->Fill(4.2,7.9);
		h2->Fill(4.3,7.3);
 
    //get Y mean per X bin
		TH1D *hx = new TH1D("hx","hx",10,0,10);
    
	    for (Int_t n = 0; n<10; n++)
		{
		  TH1D *h1 = h2->ProjectionY("h1",n,n,"e");
	      Double_t meany = h1->GetMean();	
		  //print the value of Y mean
		  cout<<"The <Y> is "<< meany << endl;
		  hx->SetBinContent(n,meany);
		}	
	 
	  //Draw pictures
	  TCanvas *c1 = new TCanvas("c1","c1",400,800);
		c1->Divide(1,2);
		c1->cd(1);
	    h2->GetXaxis()->SetTitle("X");
	    h2->GetYaxis()->SetTitle("Y");
        h2->Draw("colz");
	    c1->cd(2);
	  hx->GetXaxis()->SetTitle("X");
	  hx->GetYaxis()->SetTitle("<Y>");
	  hx->Draw("hist");
	}

my question is what I want to get is the mean of the dot Y not the mean of bin center Y.


图片2

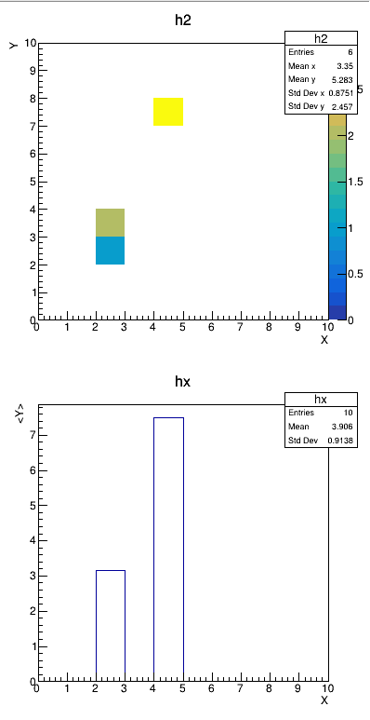
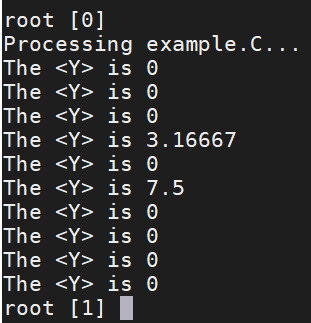
As shown in the Figure 1, the mean what I want to obtain is equal to (3.4+3.1+2.1)/3=2.867 for binX = 3. However, the real result is (3.5+3.5+2.5)/3 = 3.16667.

How do I modify my code?

Best Regards,
hurricane

Hi,

It seems what you want is to use the TProfile class, which computes for you the mean in y for every x. See ROOT: TProfile Class Reference
You should create and fill a Profile from the beginning. You could also project from a TH2 to a TProfile, but in that case the bin centre in y will be used instead of the real y values used to fill the histogram.

Cheers

Lorenzo

Thanks for your reply.
I have used TProfile, which isn’t what I want to achieve.
As I just said, what I want to obtain is the mean of real Y value not the average Y according to binY.

So what should I do?

Best regards,
hurricane

Hi,
TProfile computes the mean of the filled Y values. Is not this what you want ?

Thanks for your discussion.
I have tried TProfile. A Profile histogram is a way of projection 2D data. For each bin in X the samples mean of the y values is plotted.
For example, the real result is (3.5+3.5+2.5)/3 = 3.16667 for binX = 3 when using TProfile. However, the mean what I want to obtain is equal to (3.4+3.1+2.1)/3=2.867 for binX = 3.

{
  TProfile *hp = new TProfile("hp", "hp", 10, 0., 10., 0., 10.);
  hp->Fill(2.3,3.4);
  hp->Fill(2.3,3.1);
  hp->Fill(2.9,2.1);
  hp->Fill(4.1,7.9);
  hp->Fill(4.2,7.9);
  hp->Fill(4.3,7.3);
  hp->Draw();
}

Please read this carefully:

Yep. I understand now. You are right. Thank you very much!!!

Best Regards,
hurricane

Very clear! It helps a lot. Thank you very much!!!

This topic was automatically closed 14 days after the last reply. New replies are no longer allowed.