Carlos
February 10, 2018, 5:28pm
1
Hi. I’m trying to fill a histograms with some data. The code I have is similar to this example. Suppose I have some data of the function x^2 (real problem is no with a function but with measured data, so I can’t use graph instead histogram)
TH1D *event;
event = new TH1D ( "Event example" , "event", 1000, 0, 1000);
for(int i=1; i<1000; i++){
      event->Fill((x-500)^2)
    }
When I see the histogram I don’t see the parabola but other thing. So the I have tried to make
for(int i=1; i<1000; i++){
      event->Fill(i,(x-500)^2)
    }
The problem now is that in addition to the parabola I want, I obtain other lines that I don’t know how to delete them. Can anyone help me?
yus
February 10, 2018, 8:59pm
2
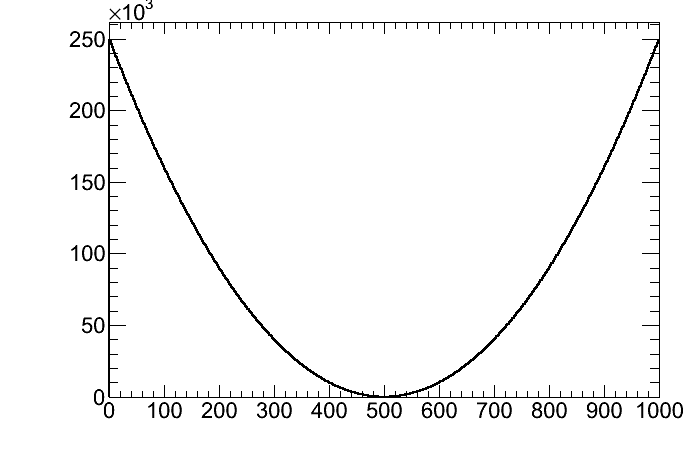
Hi Carlos,
the (x-500)^2 does not mean "(x-500) squared" in C++, pow(x-500, 2) does. After changing your piece of code into
TH1D *event;
event = new TH1D ( "Event example" , "event", 1000, 0, 1000);
for(int i=1; i<1000; i++){
    event->Fill(i, pow(i-500, 2));
}
event->Draw();
I ran it and got this:
Which lines are you talking about?
Carlos
February 10, 2018, 10:02pm
3
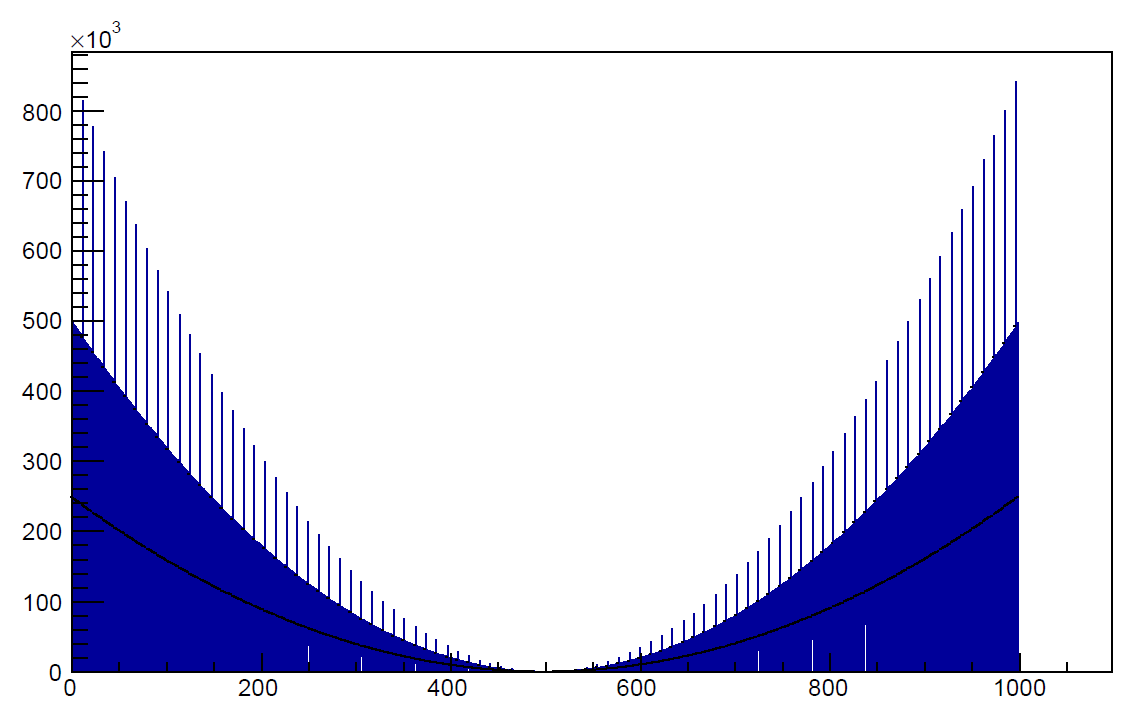
Hi yus. Thank you for your answer. That’s not the problem. I wrote it wrong here but not in my code. The image you posted is what I want, but this is what I actually get:
As you can see there is the line that you obtained + undesired blue stuff.
Carlos
February 11, 2018, 1:54am
5
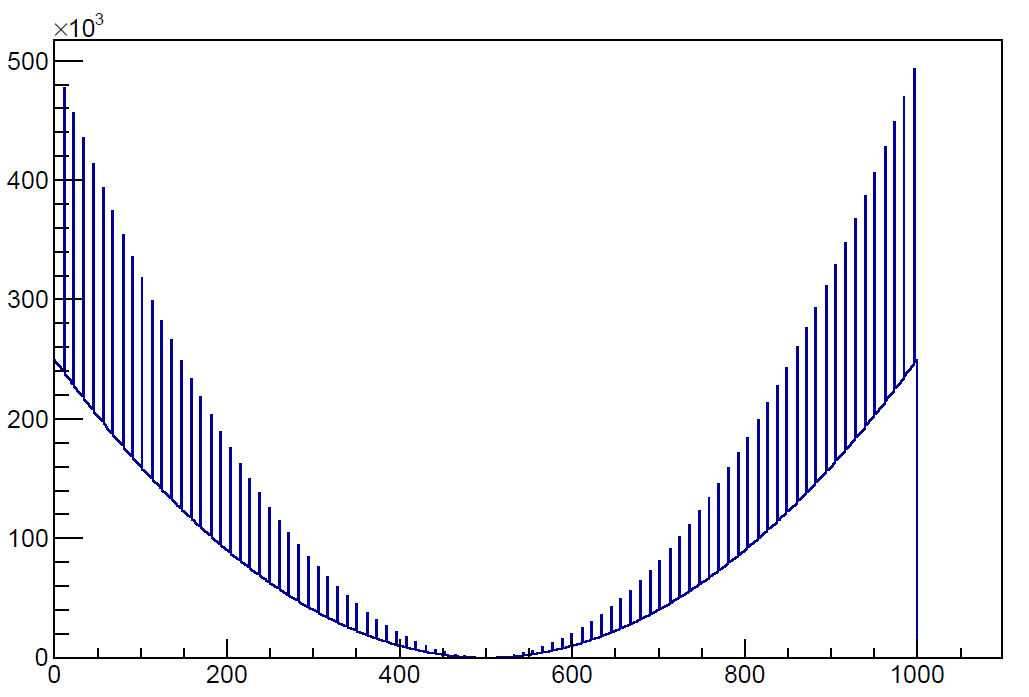
Hi. Still having some trouble:
It seems to me that for some bins you call “Fill” twice.
yus
February 11, 2018, 11:10am
7
Hi,
event = new TH1D ( "Event example" , "event", 1000, 0, 1000);
, but in your screenshot the histogram goes up to 1100 - why?
system
February 25, 2018, 11:10am
8
This topic was automatically closed 14 days after the last reply. New replies are no longer allowed.