Dear Experts,
I am not sure if I should ask this question here as it is mainly a Delphes question instead of a ROOT question. But I hope I can find many people who know Delphes in this forum. I am running Delphes over a semi-leptonic ttbar event generated by MadGraph+Pythia8. Everything looks fine in the output, until I start digging into constituents of each jet. I basically ran /examples/Example3.C on the sample, which outputs a histogram for (jet->PT - sum(jet->Constituents().P4).Pt())/jet->PT. Naively you would expect this has a peak at 0 because the sum of constiuents is the jet itself by definition. However the result looks like the following:
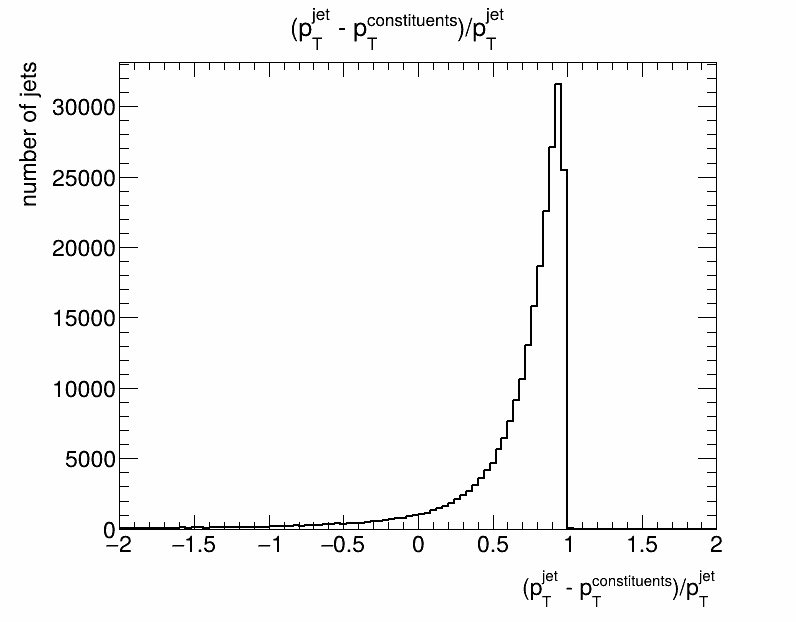
Any idea what can possibly cause such behaviour?