Dear @LeWhoo ,
I’ve been exploring your use case extensively, trying out many things. I started profiling the memory usage for your application with GitHub - bloomberg/memray: Memray is a memory profiler for Python · GitHub , which produces very detailed reports that can be turned into flamegraphs showing both the total heap size as well as the RSS over time.
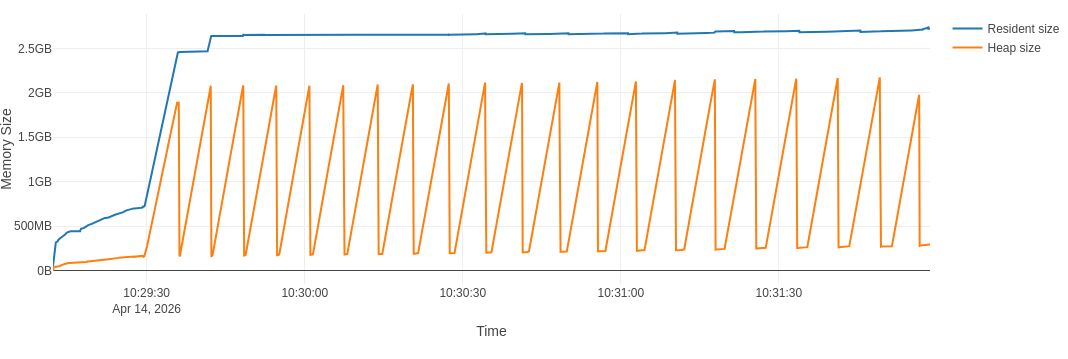
With regards to the example at hand with AsNumpy, visible at CERNBox, this is a typical graph I see
With the full flamegraph visible at CERNBox
Then I went on and I changed slightly the example. Everything stays the same, except I substitute the AsNumpy operation with Take (see example at CERNBox):
col_type = "ROOT::RVec<std::vector<std::vector<float>>>"
df.Range(begin, end).Take[col_type]("trace_ch").GetValue()
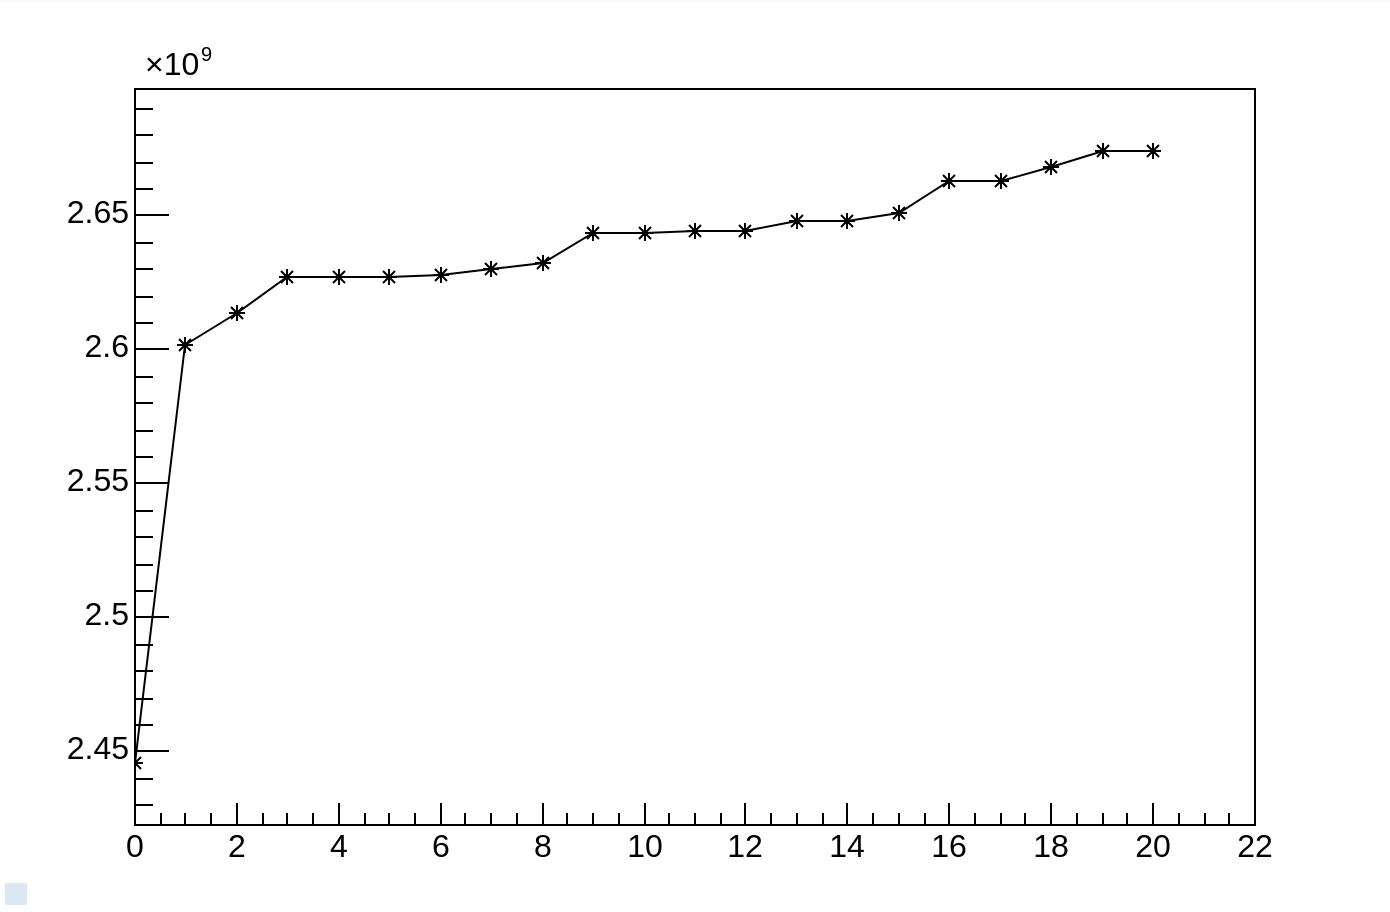
The flamegraph is different in the fact that I see drops and rises of the RSS
But when I zoom in, I see that there is still some leftover rising trend in the peaks of RSS: the second highest peak is at 3.35GB and the last peak is at 3.40GB
The full flamegraph is visible at CERNBox
For the record, I also used the integration of awkward array with RDataFrame, as in
        range_df = df.Range(begin, end)
        awkward.from_rdataframe(range_df, "trace_ch")
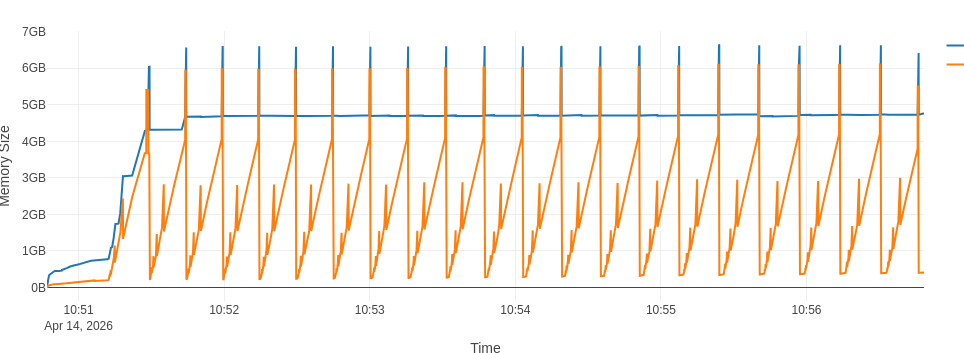
In each iteration of the for loop, see example at CERNBox. This does not change the picture much, but does increase both the total heap size and the RSS substantially:
Note that the peaks now hover around the 7GB mark. The full flamegraph is available at CERNBox
From this analysis I can see that there are multiple factors at play that contribute to your memory usage:
First, the size of your data
Your dataset is made of deeply-nested, very large arrays. The flamegraph with the raw Take operation shows that even the net heap size reaches 2.8GB at each iteration, which is just the size of the vectors you have.
Then, the specific type ROOT::RVec<std::vector<std::vector<float>>> is also more complicated to deal with than a flat vector. At each event fill, the higher-level array that will represent your event batch (in this case of size 3000) must allocate (and most often re-allocate) for the entirety of one ROOT::RVec<std::vector<std::vector<float>>> object at a time
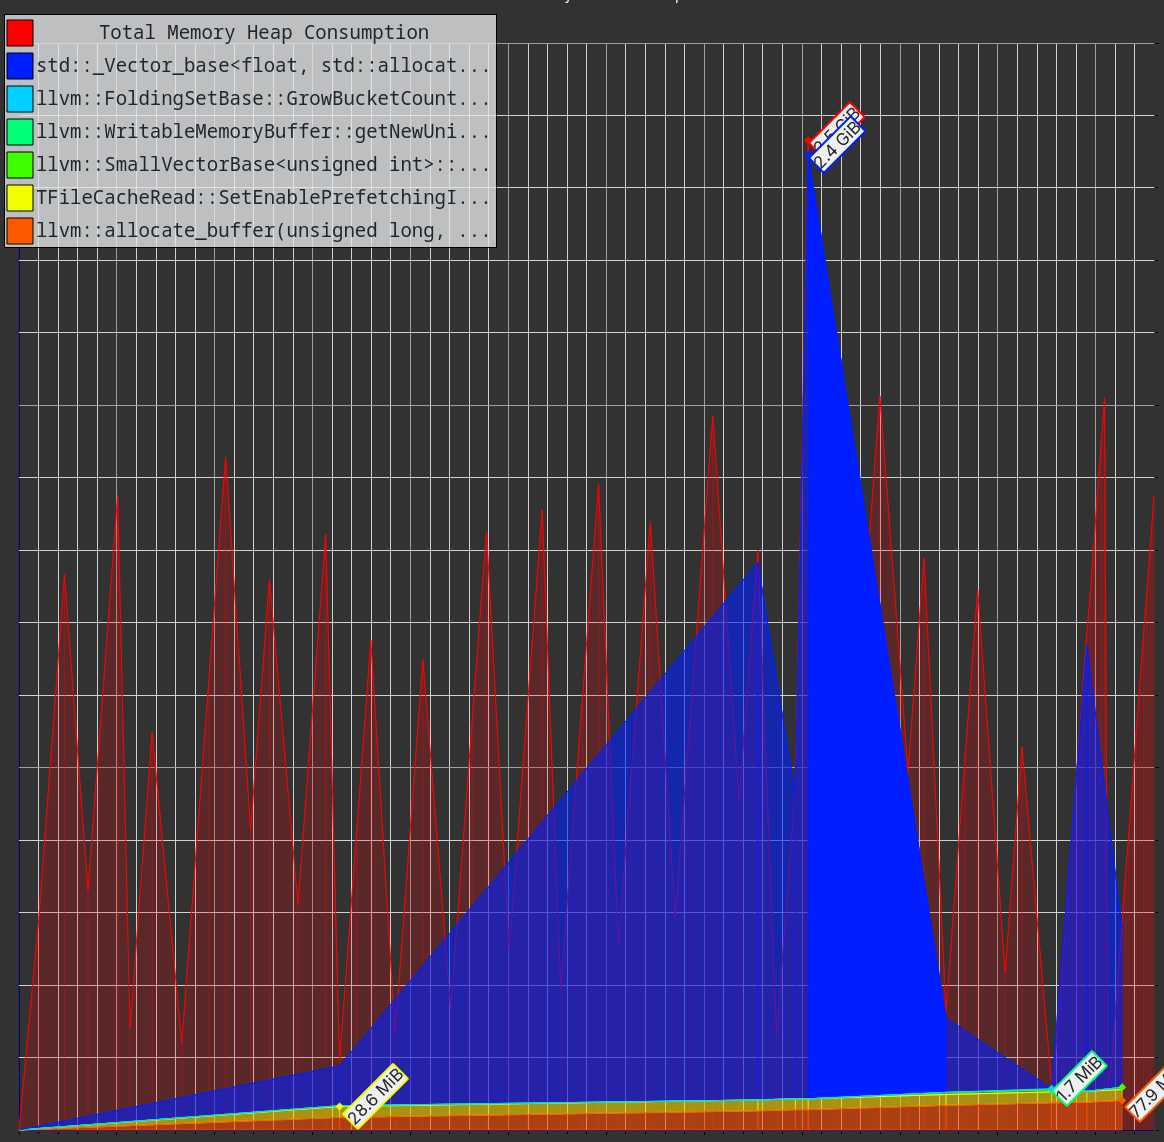
This is even more noticeable when changing the Python code to C++. I did that (see example CERNBox) and I profiled it with valgrind --tool=massif. Here is the output massif file CERNBox. You can visualize it for example with Massif-Visualizer - KDE Applications which shows
The vast majority of your memory is used by your own data.
Second, the specific implementation of AsNumpy
After removing the largest contributor, there is still the difference represented by the fact that while Take shows rises and drops in the RSS, in conjunction with the end/beginning of the next batch creation, AsNumpy instead shows a steady increase in the RSS consumption. This difference is most likely due to the fact that we’re creating a numpy.array with dtype=object, because ROOT::RVec<std::vector<std::vector<float>>> can’t be represented with a numpy native type. For each 3000-sized batch, we are creating and destroying 3000 Python objects that wrap the C++ type. This may trigger lookups in the Python-C++ bindings engine to instantiate and call the function (destructor) responsible for deleting that C++ object.
I hoped this could be improved by using the awkward.from_rdataframe function which bypasses the schema above, but it actually made things worse overall.
Third, leftover TTree and interpreter allocations
There is always a bit of memory that’s not easy to get rid of.
One part of this is represented by the TTreeCache. Every TTree creates this cache for I/O optimization reasons, but it may represent a bit of leftover memory increase in your application. In my tests, I disabled this simply by calling chain.SetCacheSize(0), that’s why you don’t see it in the flamegraphs.
The other part of remaining memory increase may just be due to the interaction with the interpreter which happens at multiple levels (RDF surely, but also in the I/O with TTree and TFile). There’s nothing I can practically do here. In principle, if your application allows, you could think about wrapping each batch iteration in a subprocess which would then destroy all the allocated memory
# This bit must be saved to another Python script, e.g. "work.py"
def run_df(begin, end):
    # Create the RDF here and do stuff with it within the given range

# This bit can be executed from the main script
for begin, end in ranges:
    subprocess.run([sys.executable, "work.py", str(begin), str(end)])
All in all, let me say that I’m not fully satisfied with these results, but I don’t see any immediate thing we could do to improve the situation. Most of the memory is used by your data, which is clearly non negotiable, the leftover comes mostly from interactions with the interpreter which can’t be generally fixed except by working around them with the subprocess approach.
Cheers,
Vincenzo