Hello,
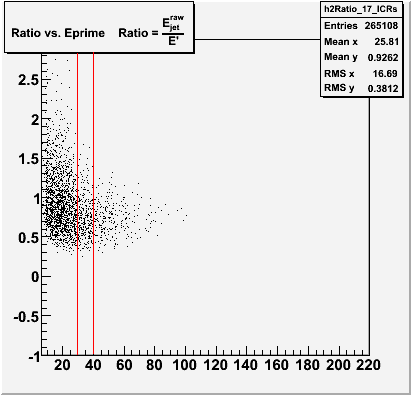
I filled a TH2 with weights (see attached figure and the macro created by root). If we look into the macro, we got:
...
Double_t xAxis[18] = {6, 9, 12, 15, 20, 25, 30, 40, 55, 70, 90, 105, 130, 160, 220, 350, 500, 800};
   TH1 *h2Ratio_17_ICRs = new TH2D("h2Ratio_17_ICRs","Ratio vs. Eprime    Ratio = #frac{E_{jet}^{raw}}{
E'}",17, xAxis,80,-1,3);
   h2Ratio_17_ICRs->SetBinContent(414,2.92758e-06);
   h2Ratio_17_ICRs->SetBinContent(415,1.46379e-06);
   h2Ratio_17_ICRs->SetBinContent(416,3.60632e-08);
   h2Ratio_17_ICRs->SetBinContent(431,0.000116673);
   h2Ratio_17_ICRs->SetBinContent(432,3.88911e-05);
...
where cell bin numbers and its content are shown. My confusion is, as you see on the figure attached, all points in one same X bin, for example, for the Xaxis region: 30-40, have different x values, how are they plotted since “SetBinContent” is to fill cell by cell instead of the way of point by point? If we use Draw(“colz”), it is okay for me to understand how they are drawn since each “SetBinContent” line fills each cell.
Cheers,
Zhiyi.
root Version 5.08/00;
Linux: Mandrake 10.2
c1.C (73 KB)