Hello Everyone,
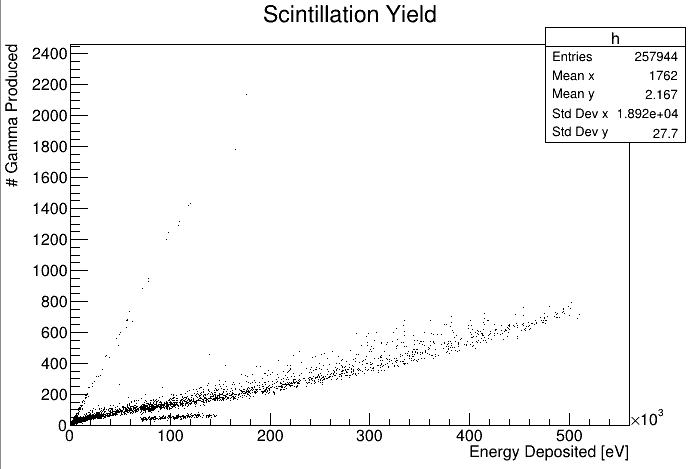
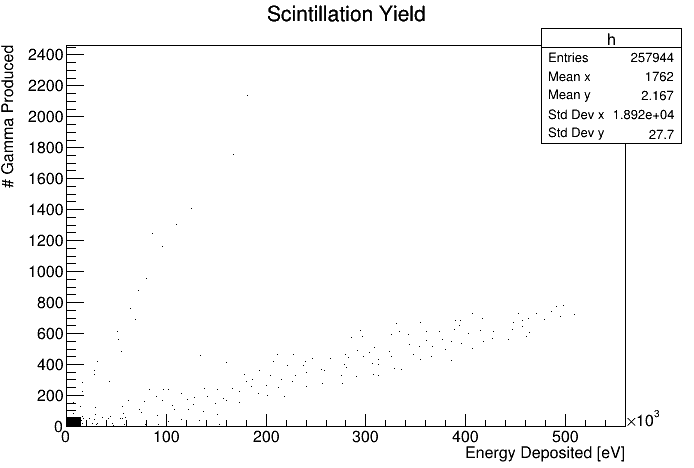
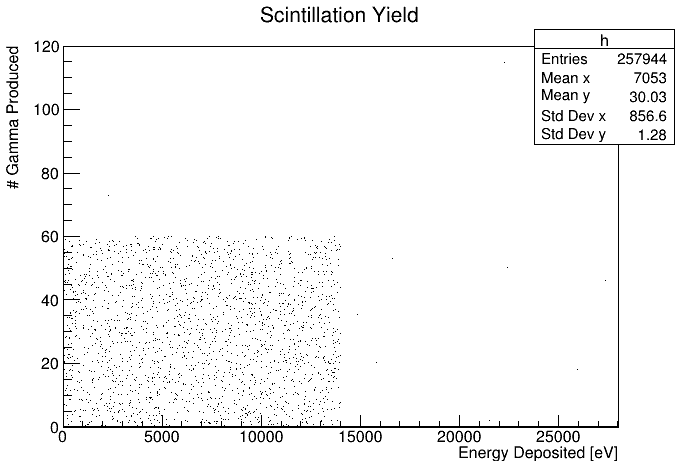
I am very new to ROOT and am trying to plot a 2D scatter plot of some simulated data from GEANT4. This data comes in the form of a TTree (called ‘Scintillator’) that lives in a directory (‘ntuple’). In this data, I am trying to plot ‘NumGammaProduced’ vs. ‘Edep’.
I can get the plot working using the TTree::Draw function but, whenever I try to show the stats of the plot, I only see 0s. I am very new to this software so please excuse any beginner mistakes. Attached is the macro that I am currently using in case it helps - it should be relatively simple.
void test(string fName){
// add extension
if (fName.find('.') == std::string::npos) {
	fName.append(".root");
}

// load file
cout << "Loading " << fName << "..." << endl;
TFile f(fName.c_str());

// grab data
TTree* tScint = (TTree*)f.Get("ntuple/Scintillator");

// plot scintillator ntuple details
tScint->Draw("NumGammaProduced:Edep>>h","");

auto h = (TH2F*)gPad->GetPrimitive("h");
h->SetTitle("Scintillation Yield");
h->GetXaxis()->SetTitle("Energy Deposited [eV]");
h->GetYaxis()->SetTitle("# Gamma Produced");
h->SetStats(kTRUE);
}
The plot of my output is attached, showing the null stats.
Any help would be greatly appreciated!
broken.pdf (367.1 KB)