I am trying to create a 2D histogram similar to the one shown below in ROOT/PyROOT.
In python, it was made with imshow() as the data structure is in 2D array:
wire1/channel number1 [( ADC1, ADC2, …)]
wire2/channelnumber2 [(ADC1, ADC2 )]
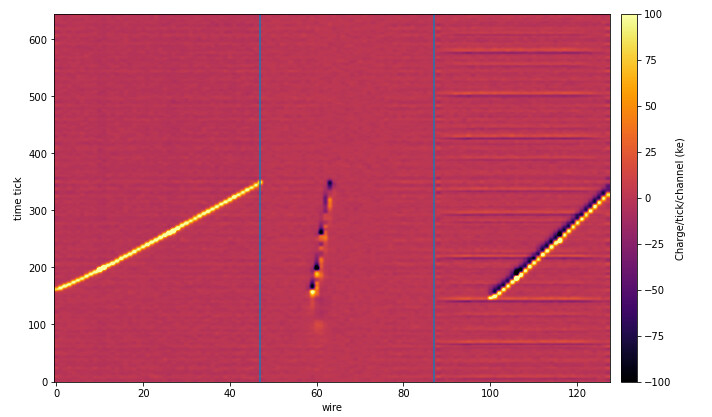
I have a root file with branch as channel number with ADC value inside it.
I was able to create a 2D histogram up to this point for only one channel:
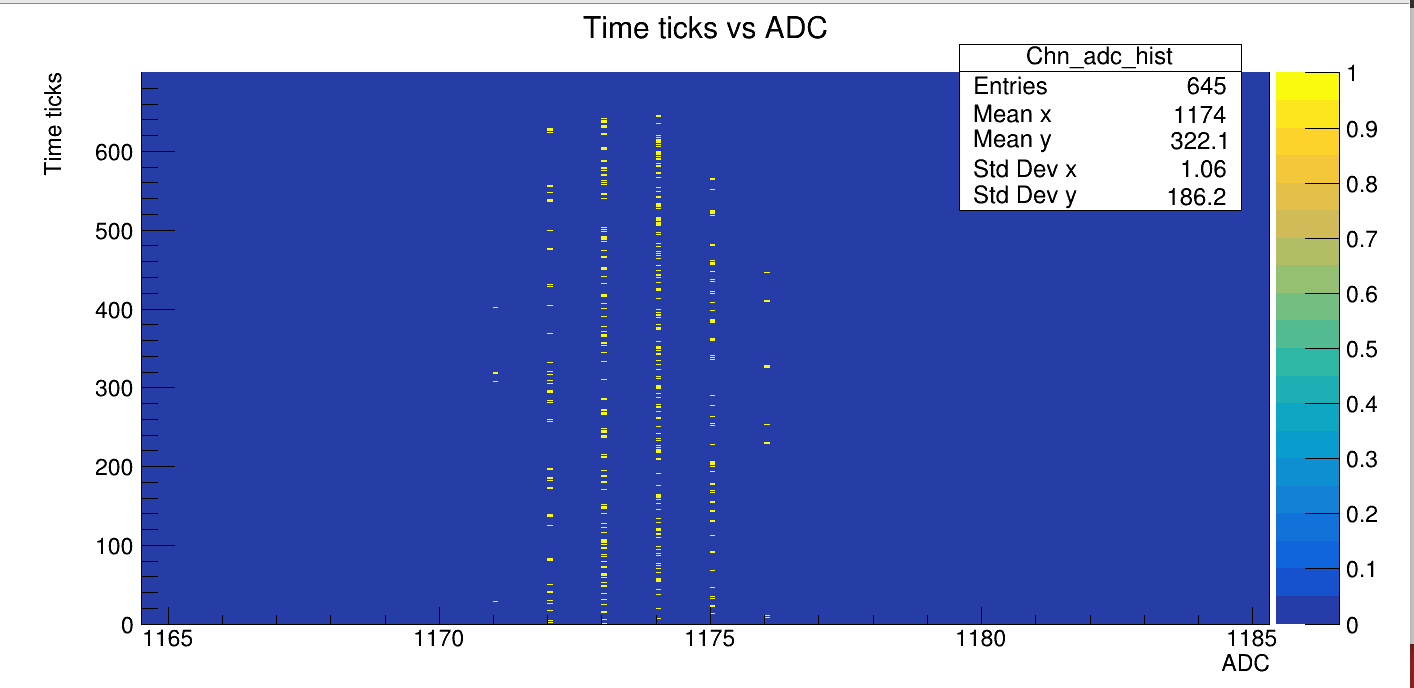
I am not sure how to get all the channels in x-axis as shown in the first plot and ADC values in the “count section”. Please help me out. Thank you.
My code:
 4 void code8()
  5 {
  6         TFile *fInput = new TFile("js2rt.root", "READ"); //READ
  7         TTree *tree = (TTree*)fInput->Get("0");
  8
  9         Int_t chn0;
 10         tree->SetBranchAddress("chn0", &chn0);
 11         //tree->SetBranchAddress("z", &z);
 12
 13         TH2D* hist = new TH2D("Chn_adc_hist", "Time ticks vs ADC; ADC; Time ticks", 1000, 1100, 1200 ,1000, 0, 750 );
 14
 15         Int_t entries = tree->GetEntries("chn0");
 16
 17         for(Int_t i = 0; i < entries; i++) {
 18
 19         Int_t ticks = i; //timeticks
 20         tree->GetEntry(i);
 21         hist->Fill(chn0, ticks);
 22
 23     }
 24
 25         hist->Draw("COLZ2");
 26 }
~