I am attempting to declare and fill a 2D histogram with two variables, but for some reason it just fills the x and y axes as if it were a 1D histogram. In the header file I have declared the 2D histogram as follows with 100 bins for both axes:
TH2F *invm1234 = new TH2F(“invm1234”,“Invariant mass jets 1 2 3 4”,100,0.,300,100,0.,300);
After specifying the variables I to try to fill it as follows:
The result I get fills for the x and y axes but it’s as if the code doesn’t process the fact that there needs to be another axis in 3D space for the number count.
Right, I see, I didn’t realize the scatter diagram was just the default option. I have tried following one of the examples to get the LEGO example plot but when I add the TCanvas to my header file and put return c2 into my analysis code it produces an error when I try to re-compile. I take it the TCanvas part is necessary when making stylistic changes to a 2D histogram in this way?
I’ve deleted the return and just asked it to draw it in the style I am looking for (ie. LEGO), but it still won’t do it, is it something to do with the way I am filling the histogram? I am simply taking a 2D histogram and asking it to fill with 2 variables where I have specified the number of bins for each axis.
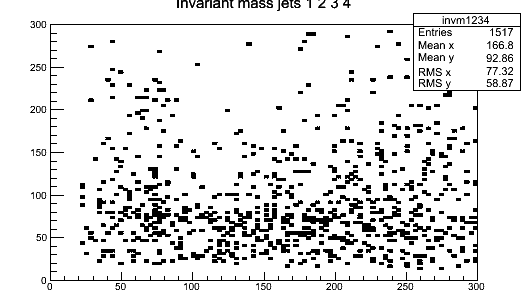
In the first post above you show a picture which you probably got using something like invm1234->Draw(); so try simply with invm1234->Draw("LEGO"); instead and you should get it, too.
Unfortunately not, that picture gets produced without any draw command, I just ask it to fill the histogram and it produces that picture. When I try Draw(“LEGO”) it just produces the same picture again.
I am using analysis code rather than ROOT macros, I have looked through the cpp file, the makefile and the header file which together make up the analysis code and there is no other reference to a Draw command apart from the one I am trying to add to the cpp file.
Basically I have a line of code in the header file:
TH2F *invm1234 = new TH2F(“invm1234”,“Invariant mass jets 1 2 3 4”,100,0.,300,100,0.,300);
If I ask it to fill with 2 variables in the cpp file, it just draws a scatter plot by default: is there something I can do to the code above in the header file to specify that I need it to draw the plot in a style different from the default one?