Hello, I am new to ROOT and I have tried using PyROOT to easily manage to work with it, however when i came to fit a 2D Gaussian sum on a 2 Histogram, I have encountered few problem such as the fact that the fitting appeared twice and it seemed one of the fits isn’t enclosed in the area i have provided. I wanted to know if there was a way to say from what point to what point on the y axis do I want to fitting to occur. Also the fitting seems quite off even though I have entered the best conditions for the function.
Also finally I have noticed that when i made the 2D Histogram based on a two 1D Histograms, the maximum of the peaks went from 2000 to 25. Is there a reason which would explain why the number decreased this much or is it a problem ?
I provide the code in python:
import ROOT
import numpy as np
import struct
import argparse
from ROOT import TCanvas, TFile, TProfile, TNtuple, TH1F, TH2F, TF1, TLegend, gStyle, TF2, TCutG
from ROOT import gROOT, gBenchmark, gRandom, gSystem
def toInt(bytes):
result = int(bytes[::-1].encode("hex"), 16)
return result
if __name__ == "__main__":
parser = argparse.ArgumentParser(
description="Reads data file saved by DRS4 board and saves it in ROOT histograms."
)
parser.add_argument("inputFile", help="File saved by DRS4 board")
parser.add_argument("outputFile", help="ROOT file that will contain histograms.")
parser.add_argument("Textefile", help="extract data from file")
parser.add_argument("-n", default=1e10, type=int, help="Maximum number of events to be read")
args = parser.parse_args()
inFile = open(args.inputFile, "rb")
outFile = ROOT.TFile(args.outputFile, "recreate")
Texte= open(args.Textefile, "r")
firstWord = inFile.read(4)
print("First word in the file:", firstWord.decode("utf-8"))
boardNumber = inFile.read(2)
actualNumber = inFile.read(2)
print(
"Second word in the file:",
boardNumber.decode("utf-8"),
toInt(actualNumber),
)
timeData = np.zeros((4, 1024))
chData = np.zeros((4, 1024))
for i in range(4):
d = inFile.read(4)
if d == b"EHDR":
#print("Time bins finished. Found event header")
break
#if d[:2] == b"B#":
#print("New board found :", d[:2], toInt(d[2:]))
#print("Would probably need fixing!")
if d[:3] == b"C00":
#print(i, int(d[3:]))
#print("Channel {0} Channel ID : {1}".format(i, int(d[3:])))
for j in range(1024):
f = inFile.read(4)
[x] = struct.unpack("f", f)
timeData[i][j] = x
Lines = Texte.readlines()
LL=[]
y=0
for Line in Lines:
LL = LL + [float(Lines[y])]
print(LL)
y=y+1
#Time is consistant, we have only 1 column which will display the time.
I=[]
I2=[]
T=[]
nEntries = 0
while True and nEntries < args.n:
buf = inFile.read(4)
if not buf:
break
print("Event number: {0}".format(toInt(buf)))
date = []
for i in range(8):
date.append(toInt(inFile.read(2)))
print("Date", date[0], date[1], date[2])
boardNumber = inFile.read(2)
actualNumber = inFile.read(2)
print(
"Second word in the file:",
boardNumber.decode("utf-8"),
toInt(actualNumber)
)
triggerCell = inFile.read(2)
actualCell = inFile.read(2)
print(
"Trigger Cell:",
triggerCell.decode("utf-8"),
toInt(actualCell)
)
for i in range(4):
d = inFile.read(4)
if d == b"EHDR":
#print("\n\nFound event header. New event starting\n")
break
#if d[:2] == b"B#":
#print("New board found :", str(d[:2]), toInt(d[2:]))
#print("Would probably need fixing!")
if d[:3] == b"C00":
#print("Channel {0} Channel ID : {1}".format(i, int(d[3:])))
for j in range(1024):
f = inFile.read(2)
x = toInt(f)
chData[i][j] = x
# channel data is consitant but we must separate both channel datas
III=0
II=0
TT=0
for u in range(0,len(chData[1])):
X=chData[1]
Y=chData[0]
III= III + 1/65535. * Y[u] - 0.5
II= II + 1/65535. * X[u] - 0.5
TT= TT + 1
III0=LL[0]*III+ LL[1]
II0=LL[2]*II+ LL[3]
I = I + [II0]
I2 = I2 + [III0]
T = T + [TT]
nEntries += 1
# Create some histograms, a profile histogram and an ntuple
hpx = TH1F( 'hpx', 'This is the event distribution', 100, 1, 1.6 )
for h in range(0,len(I)):
hpx.Fill(I[h])
# Update display every kUPDATE events.
# Create some histograms, a profile histogram and an ntuple
hpx2 = TH1F( 'hpx2', 'This is the event distribution', 100, 1, 1.6 )
for g in range(0,len(I)):
hpx2.Fill(I2[g])
# Update display every kUPDATE events.
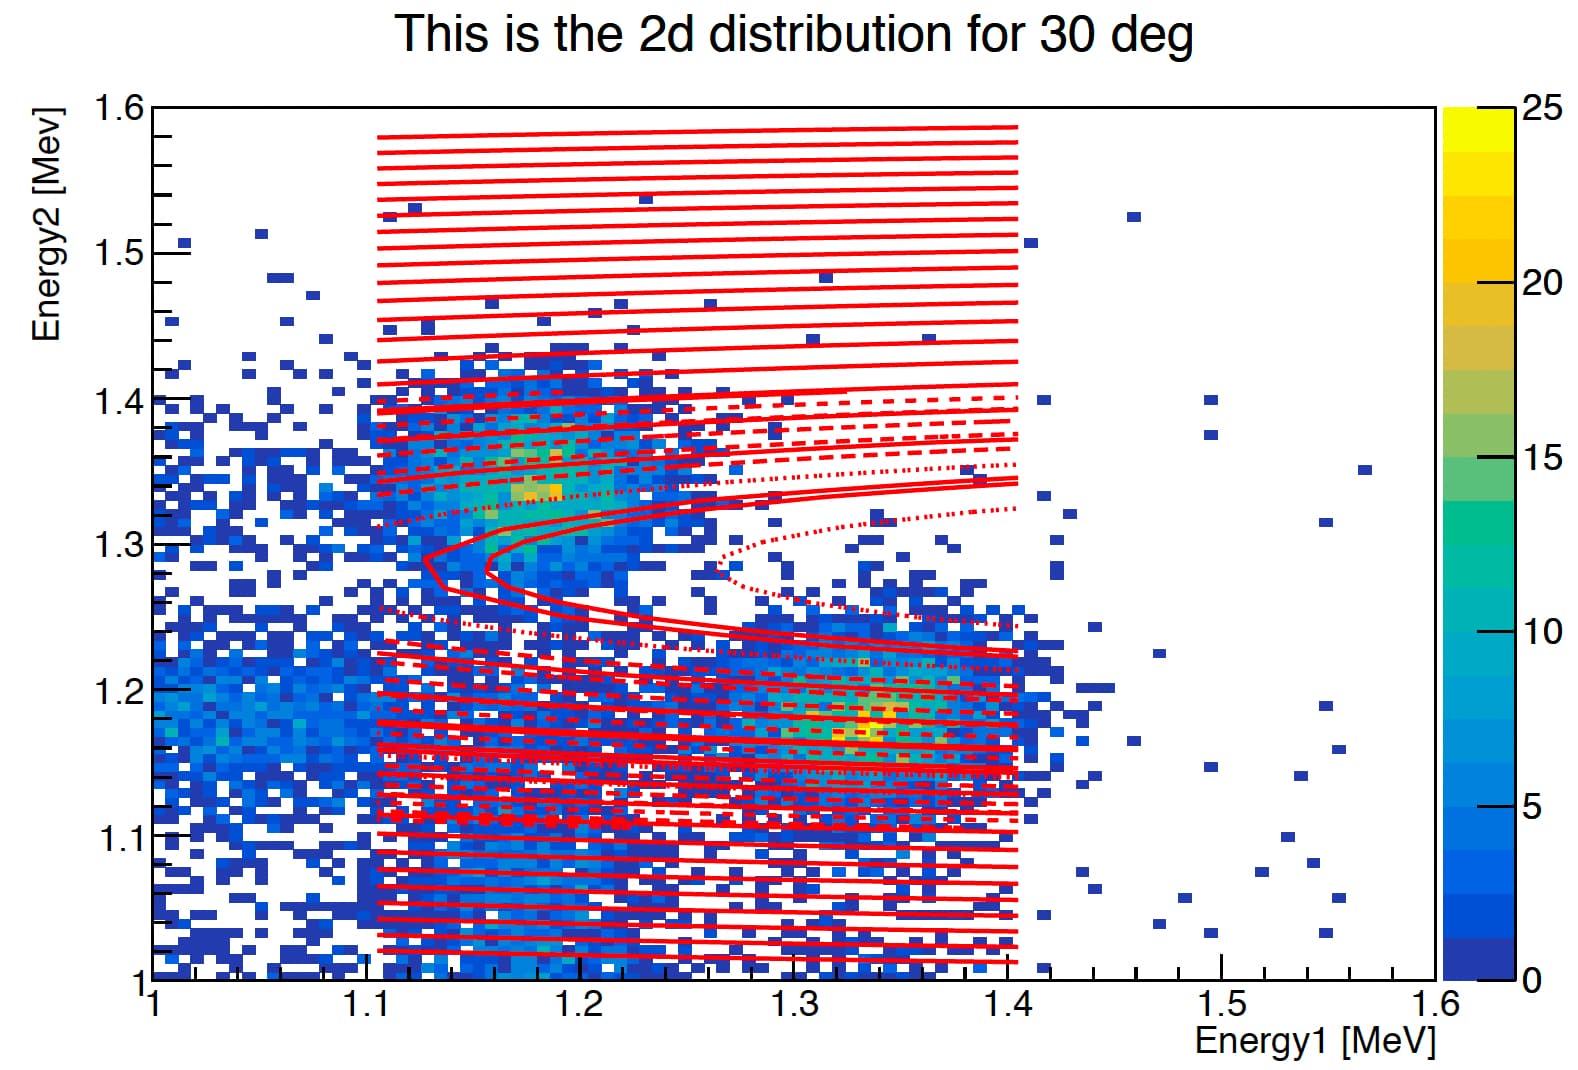
hpx2d = TH2F( '30 deg', 'This is the 2d distribution for 30 deg', 100, 1, 1.6 , 100, 1, 1.6 )
gStyle.SetOptStat(0)
hpx2d.GetXaxis().SetTitle(r"Energy1 [MeV]")
hpx2d.GetYaxis().SetTitle(r"Energy2 [Mev]")
for s in range(0,len(I)):
hpx2d.Fill(I[s],I2[s])
# Update display every kUPDATE events.
#hpp = TF2("gauss","[0]*exp(- (((x-[1])^2)/[3] + ((y-[2])^2)/[4])) + [5]*exp(- (((x-[6])^2)/[8] + ((y- [7])^2)/[9]))", 1.1, 1.41, 1.1, 1.41)
#hpp.SetParameters(5,1.17,1.333,0.12,0.12,5,1.333,1,17,0.12,0.12)
hpp = TF2("gauss","xygaus(0) + xygaus(5)", 1.1, 1.41, 1.1, 1.41)
hpp.SetParameters(25,1.17,0.12,1.333,0.12,25,1.333,0.12,1,17,0.12)
hpx2d.Fit(hpp,"","",xmin=1.1,xmax=1.41)
r= TCanvas()
hpx2d.Draw("colz")
hpp.Draw("same")
r.Write()
r.SaveAs("deg302ed.pdf")
outFile.Write()
outFile.Close()
inFile.close()
Texte.close()
this is what it shows