Dear Experts,
I’m new to drawing 1D histograms in ROOT and I’m having trouble finding out how to maintain the same size of the bins on the x-axis.
Also, how would one draw vertical lines separating said bins?
I’d greatly appreciate any help in this matter. Thank you!
ROOT Version: 6.14/04
Built for macosx64
From tags/v6-14-04@v6-14-04
(I use MacBookAir.)
You control the bin size by creating the histogram carefullly, either by giving the appropriate:
- nbins, xlow and xup, or
- nbins and xbins (array)
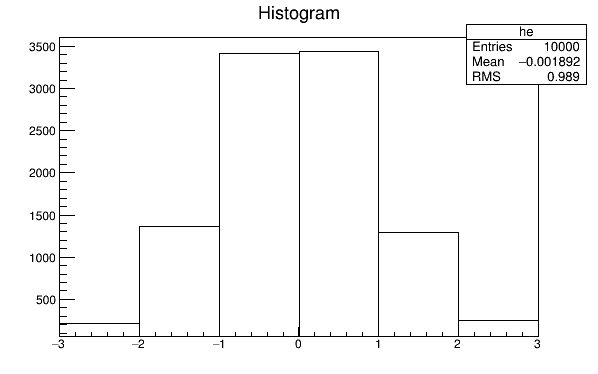
To see bars on the bins, you can use SetFillStyle(0) and draw with the “bar” option:
   auto c1 = new TCanvas("c1","c1",600,400);
   auto he = new TH1F("he","Histogram",6,-3,3);
   for (int i=0; i<10000; i++) he->Fill(gRandom->Gaus(0,1));
   he->SetMarkerStyle(20);
   he->SetFillStyle(0);
   he->Draw("bar");
@dastudillo Thank you, it worked! I do have one quick follow-up though. Is it possible to see the bars on the bins while still filling the histogram with a different color other than white?
I’m asking because I wish to layer multiple 1D histograms and would need to differentiate them by color. Thank you.
Check out the bar chart, offset and other drawing options:
https://root.cern/doc/master/classTHistPainter.html#HP100