Hi all,
I am trying to plot one specific column of a TTree using RDataFrame
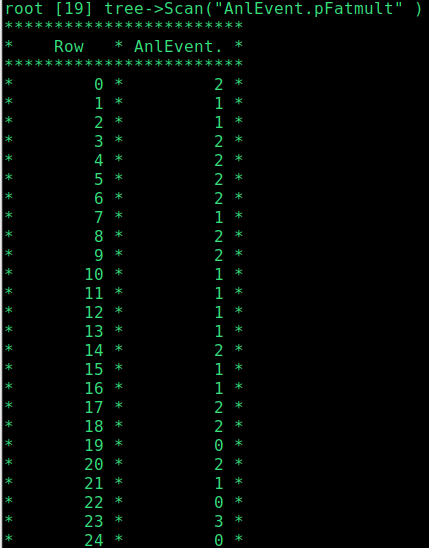
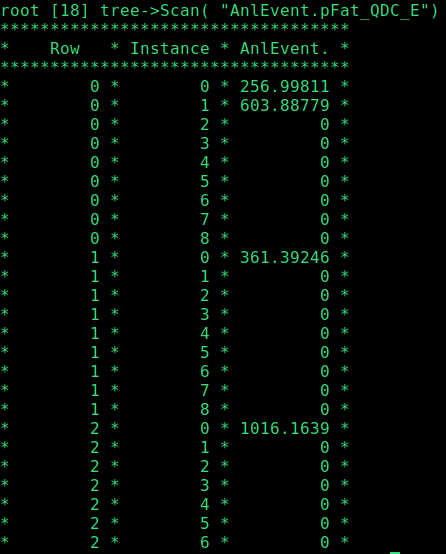
The data is organised like
Entry  Multplitcity   Energy
1       N                   {E1, E2.... EN}
2       M                   {E1, E2.... EM}
as shown in below figures as well
Multiplicities
Energies
The goal is to make a 1D Histogram of all the sub-entries within each entry as well
I would like to ask if while making a 1D histogram using RDataframe
auto hist = rdf.Histo1D<double>("AnlEvent.pFat_QDC_E[9]");
Does it automatically loop into and fill all the entries and the sub-entries as well as corresponding to the energies for a given multiplicity? Or are there some other ways to achieve this task ?
Thanks a lot in advance!