Roofit Plot not showing

I tried fitting a histogram: A peak with an exponential background; using roofit.

I defined two sub-ranges (excluding the peak region) and fitted the histogram. Following is the code:

(h1 is the pointer to my histogram)

RooRealVar x("x","mass",18,500);
      x.setRange("Range1",20.,52.3) ;
      x.setRange("Range2",106.9,500.) ;
      RooRealVar lambda("lambda", "slope", 0.01, -1., 1.);
      RooExponential expo("expo", "expo", x, lambda);
      RooDataHist dh("dh","dh",x,Import(*h1)) ;
      RooFitResult* r = expo.fitTo(dh,Range("Range1,Range2")) ;


      RooPlot* frame = new RooPlot() ;
      dh.plotOn(frame);
      expo.plotOn(frame);

But the plot is not showing. I am unsure whether the fit is accurate or not.

I saved it in a file and can see it using TBrowser. But I want it to show up when I run the script.

Any help?

You may just need to call Draw() on your RooPlot: https://root.cern.ch/doc/master/classRooPlot.html#ad7cdede86cb3721e079ec55fcb3b4edc.

1 Like

Hi Amadio,

Thanks that worked.

I now have to subtract this from the data to get the background free peak.
Do I need to create another histo with this fit function and then subtract it from h1?
Normally TF1 functions are easy to fill a histogram with. Does the RooFitResult work the same way?

Hi @Debajyoti_Sengupta,

I have two suggestions:

  1. You make an additive (extended) model including the signal:
RooRealVar x("x","mass",18,500);
RooRealVar lambda("lambda", "slope", 0.01, -1., 1.);
RooExponential expo("expo", "expo", x, lambda);

RooRealVar mass("mass","Central value of Gaussian",0,200);
RooRealVar sigma("sigma","Width of Gaussian",0,200);
RooGaussian signal("gaus", "The signal distribution", x, mass, sigma); //Or any other function. Voigt, Breit-Wigner??

RooRealVar b("b", "Number of background events", 0, 1000);
RooRealVar s("s", "Number of signal events", 0, 1000);

RooAddPdf fullModel("fullModel", "Signal + Background Model", RooArgList(signal, expo), RooArgList(s, b));
... fit ...
RooPlot* frame = x.frame();
dh.plotOn(frame);
fullModel.plotOn(frame);
expo.plotOn(frame); //One option
fullModel.plotOn(frame,Components(expo),LineStyle(kDashed)) ; //Other option
fullModel.paramOn(frame);

Sorry if I mistyped something. I don’t have your histogram to test the code.

  1. You use createHistogram() to get a histogram from your PDF.
    https://root.cern.ch/doc/master/classRooAbsReal.html#a6659d2c301e5cd65b83ee8c9422c2553

I get an error

ERROR:InputArguments -- RooDataHist::dh:plotOn: frame does not specify a plot variable
[#0] ERROR:Plotting -- RooAddPdf::fullModel:plotOn: frame does not specify a plot variable
[#0] ERROR:Plotting -- RooAddPdf::fullModel:plotOn: frame does not specify a plot variable

Oh, I overlooked that. Use instead:

RooPlot* frame = x.frame();

Hi,
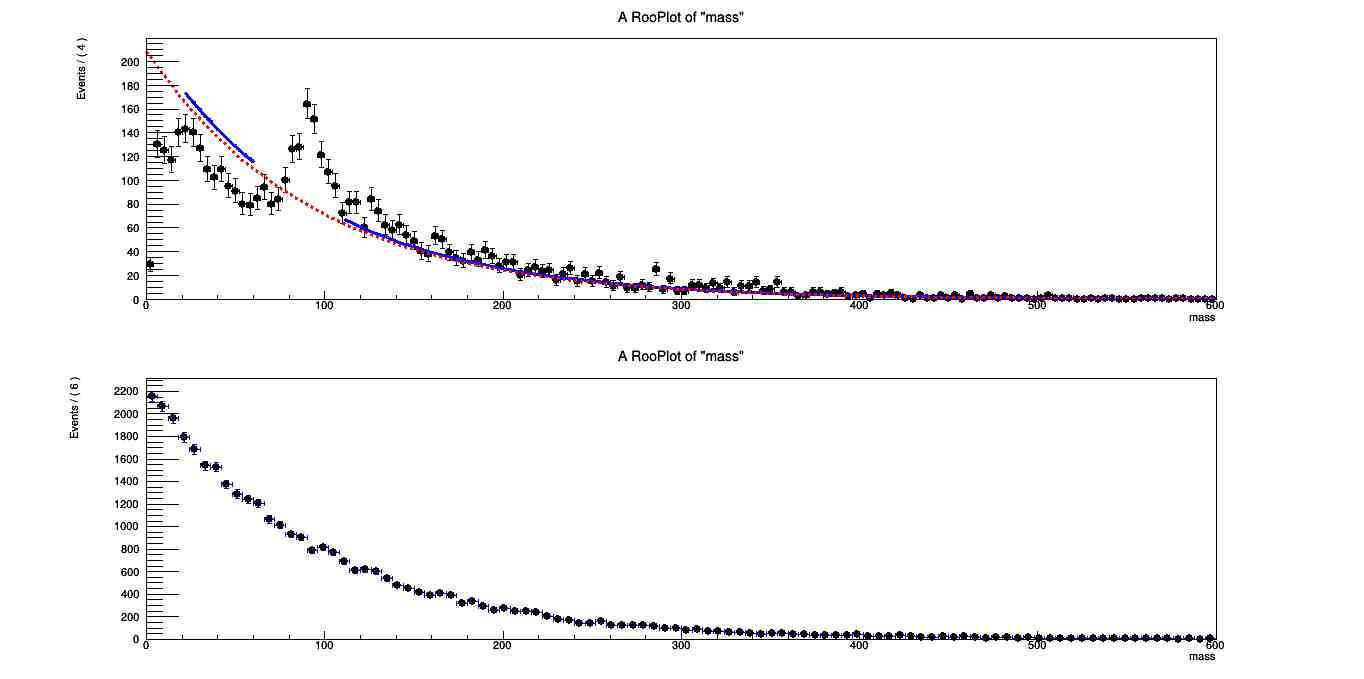
I just realised that I had tried the same thing before but without Roofit. (I was the TMath CB and expo)

What I want to do now is to subtract the side-bands from the spectrum. For this

  1. I fitted the two regions with an expo (The fit is not satisfactory) and made an extended pdf using it.
  2. I created a RooDataSet using the extended pdf and converted it to a hist (Is there a direct way of converting an extended pdf to a histogram? I can’t get createHistogram to work!)
  3. I now want to subtract the histo filled with the extended pdf from the spectrum histo. Ideally, I will be left with a Crystal ball (or a Gaussian or a BW); then I will fit the CB (or gaus or BW) accordingly.

My question is this: Is this the correct way of going about this? If so, how do I do step 3?

Ignore the titles. The first one is the spectrum with the attempted expo fit and the extended pdf. The second one is the extended pdf.

Hello @Debajyoti_Sengupta,

I would not try to subtract. It is possible, but you would get things like non-integer bin contents etc. RooFit can do a combined fit of signal plus background. It is as simple as:
fullPDF = signal + background

This is what I told you in my first reply. If you do that, you will have ALL parameters of both functions determined simultaneously and can extract both the number of signal and background events. If you still really really want to subtract, we can try to do this next week, but this week I’m travelling.

@Debajyoti_Sengupta do you have objections against me moving this thread into the regular RooFit section? I’d like to keep the content of this thread.

Sure thing. Please do :smiley:

What I ultimately want to do is fit a BW / gaussian to the signal region alone. I tried the subtraction method, but it gives me bad fit. It could be that the background is not an expo or it could be the issue @StephanH raised.

I really think that the signal+background model does exactly what you want. If you can send me the data, I can try to make it work. Did you manage to fit the function I mentioned in my post above?

This topic was automatically closed 14 days after the last reply. New replies are no longer allowed.