hi, im a new root user and need some help!  i have some data points (ascii) from an oscilattion and try to find the frequency. ive installed the fft packages. can you give me some advices how to do a fft with this plot? i only find some fft tutorials with an histo.
thanks a lot!
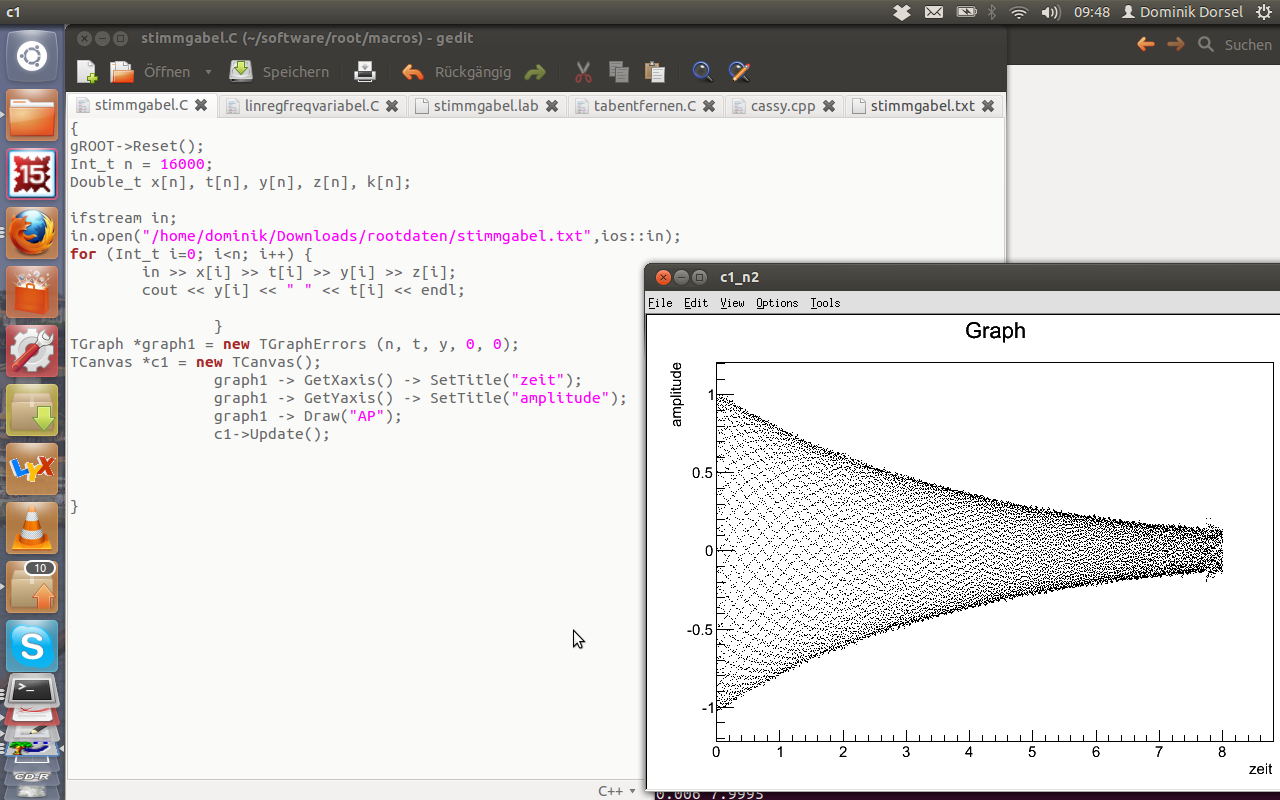
on the picture you can see the oscilattion and my little macro
hi,
but this tutorial works only for an histo, how can i do the fft with my tgraph, sry i dont get it 