TH3F/TH2F Histogram generated empty

Will be possible create a for loop inside the first if loop attributing for each file one color to place in the new histogram? Or its necessary generated new histograms for each file and add them to a new histogram?

It possible show me an example of these 2 possibilities that you talk to me for my better understanding? In this case, two question appears to me:

  1. How could I encode “encode” the file number as one additional histogram axis?
  2. How may I, after creating the histograms, place in another histogram in the same file?

I am new in programming and root too it’s that why these questions.

Thanks

Try:

{
  gROOT->cd();
  TH2F *h =
    new TH2F("energy",
             "Energies 0.03509 a 0.13509MeV with Ti 0.05mm;ELost/EKin;Counts",
             100, 0.2, 1.8,
             100, 0., 10000.);
  if (h->GetSumw2N() == 0) h->Sumw2(kTRUE);
  h->GetXaxis()->SetTitleOffset(1.8);
  h->GetYaxis()->SetTitleOffset(2.0);
  const char *files[] = { "Energy_350f.root",
                          "Energy_360f.root",
                          "Energy_370f.root",
                          "Energy_450f.root",
                          "Energy_550f.root",
                          "Energy_850f.root",
                          "Energy_1350f.root" };
  const int n = sizeof(files) / sizeof(char*);
  int color = 0;
  for (int i = 0; i < n; i++) {
    TFile *f = TFile::Open(files[i]);
    if ((!f) || f->IsZombie()) { delete f; continue; } // just a precaution
    TTree *t; f->GetObject("GmDataTTree", t);
    if (!t) { delete f; continue; } // just a precaution
    gROOT->cd();
    t->Project("energy", // each file re-fills it
               "Event_EventID : (Event_AccumulatedEnergyLost / Event_InitialKineticEnergy)");
    delete f; // automatically deletes "t", too
    color += 1; // "next" color
    h->SetFillColor(color); h->SetLineColor(color); h->SetMarkerColor(color);
    h->DrawClone((color == 1) ? "" : "SAME");
  }
  delete h; // no longer needed
}

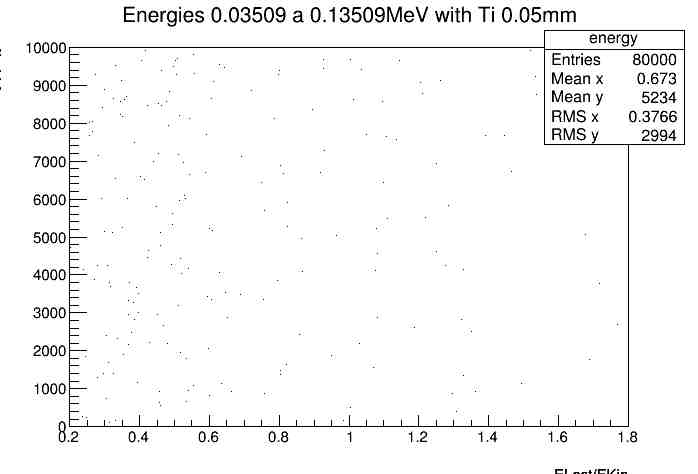
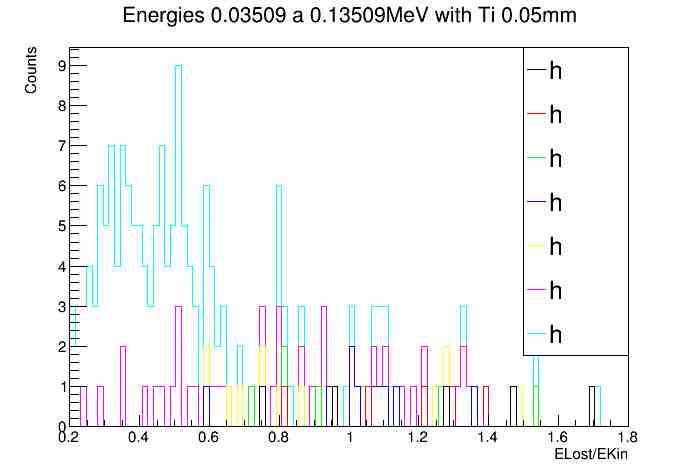
See the figure bellow (ener2.jpg). This figure is based on the code provide above.
ener2|690x468
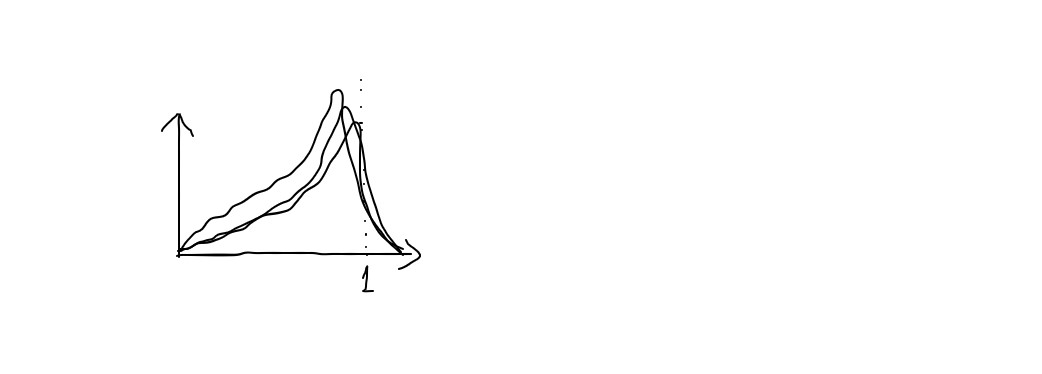
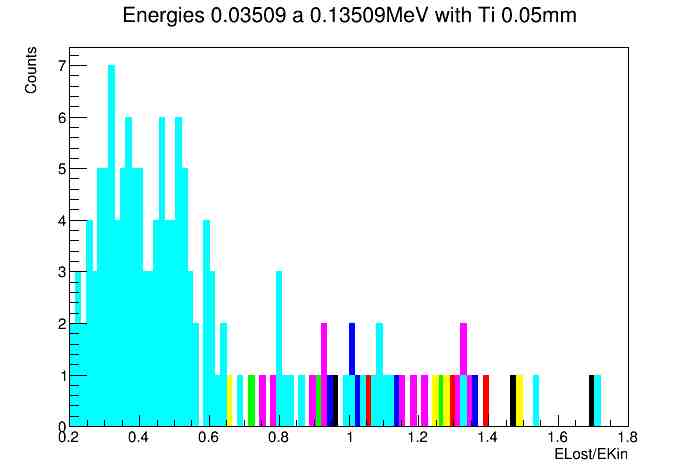
See the figure bellow (ener2a.jpg). I expected that the histogram was something like a plot of ELost/Ekin x counts (what seems to see in figures ener2.jpg and ener2a.jpg) but with the curve like figure modelo.jpg. Where each curve represents one energy.


.

I’m going to do with other files if this happens too or only with in this files…

Thanks

Try:

{
  gROOT->cd();
  THStack *hs =
    new THStack("energy",
                "Energies 0.03509 a 0.13509MeV with Ti 0.05mm;ELost/EKin;Counts");
  TH1F *h = new TH1F("h", "h", 100, 0.2, 1.8);
  if (h->GetSumw2N() == 0) h->Sumw2(kTRUE);
  const char *files[] = { "Energy_350f.root",
                          "Energy_360f.root",
                          "Energy_370f.root",
                          "Energy_450f.root",
                          "Energy_550f.root",
                          "Energy_850f.root",
                          "Energy_1350f.root" };
  const int n = sizeof(files) / sizeof(char*);
  int color = 0;
  for (int i = 0; i < n; i++) {
    TFile *f = TFile::Open(files[i]);
    if ((!f) || f->IsZombie()) { delete f; continue; } // just a precaution
    TTree *t; f->GetObject("GmDataTTree", t);
    if (!t) { delete f; continue; } // just a precaution
    gROOT->cd();
    t->Project("h", // each file re-fills it from scratch
               "(Event_AccumulatedEnergyLost / Event_InitialKineticEnergy)");
    delete f; // automatically deletes "t", too
    color += 1; // "next" color
    h->SetLineColor(color); h->SetMarkerColor(color); // h->SetFillColor(color);
    h->SetTitle(files[i]);
    hs->Add((TH1F*)(h->Clone(TString::Format("h_%d", i))));
  }
  delete h; // no longer needed
  TLegend *l = new TLegend(0.75, 0.9, 0.9, 0.25);
  for (int i = 0; i < hs->GetNhists(); i++)
    { l->AddEntry(hs->GetHists()->At(i), "", "l"); }
  hs->Draw("NOSTACK HIST"); // "NOSTACK HIST" or "HIST" or "NOSTACK L" or "L"
  l->Draw();
}

BTW. You can also try to draw it using simply hs->Draw("HIST"); (i.e. without NOSTACK), which may result in a more “readable” plot.

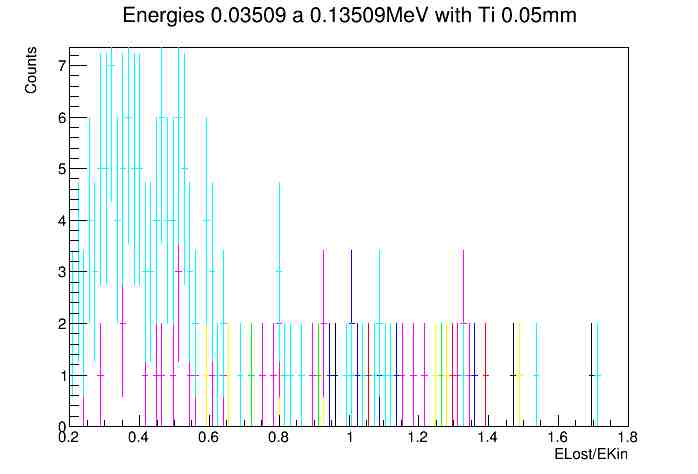
How I do for adding a legend to I see what color correspond to what energy and plot a FIT to see the line across each point of the energy. For each energy one FIT. The figure of that code is

.
Just one doubt in that case what is on the Y axis? Because originally was counts that goes from 0 to 10000.

Thanks!

From that I obtain:

It’s much better Thanks!

If I want to see the curve so that I can’t see what’s happens with the histogram tails and see the legend of each color its possible? And if I want to mainted the Event_EventID in the Y axis its possible too?

Thanks again!

There is one problem in the legend appears only h and not the name of the files…

Thanks

Thanks, @Wile_E_Coyote.

It works well!

God bless you!

This topic was automatically closed 14 days after the last reply. New replies are no longer allowed.