Hi @gurmukh_dhindsa, thanks for asking!
Based on this older forum post, I think the best you can do is to iterate over the bins, and add the bin content if the bin is inside the cut:
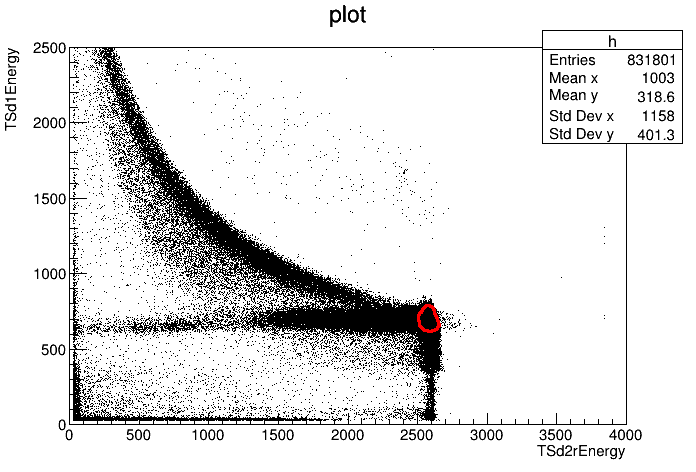
void testmycut() {

   auto file = TFile::Open("output3.root", "READ");

   auto h = file->Get<TH2F>("h");

   std::cout << "Integral of full histogram : " << h->Integral() << std::endl;

   TCutG *cutg = new TCutG("CUTG",23);
   cutg->SetVarX("plot");
   cutg->SetVarY("");
   cutg->SetTitle("Graph");
   cutg->SetFillStyle(1000);
   cutg->SetLineColor(2);
   cutg->SetLineWidth(3);
   cutg->SetPoint(0,2582.61,787.149);
   cutg->SetPoint(1,2615.72,772.773);
   cutg->SetPoint(2,2615.72,772.773);
   cutg->SetPoint(3,2628.35,723.483);
   cutg->SetPoint(4,2628.35,723.483);
   cutg->SetPoint(5,2645.34,702.261);
   cutg->SetPoint(6,2651.01,675.562);
   cutg->SetPoint(7,2659.72,654.34);
   cutg->SetPoint(8,2639.25,629.01);
   cutg->SetPoint(9,2590.89,617.372);
   cutg->SetPoint(10,2549.5,626.272);
   cutg->SetPoint(11,2549.5,626.272);
   cutg->SetPoint(12,2510.29,659.816);
   cutg->SetPoint(13,2510.29,659.816);
   cutg->SetPoint(14,2503.32,713.899);
   cutg->SetPoint(15,2512.9,735.805);
   cutg->SetPoint(16,2512.9,735.805);
   cutg->SetPoint(17,2527.28,745.39);
   cutg->SetPoint(18,2543.83,772.773);
   cutg->SetPoint(19,2562.13,790.572);
   cutg->SetPoint(20,2584.35,787.149);
   cutg->SetPoint(21,2583.04,787.149);
   cutg->SetPoint(22,2582.61,787.149);

   double integral = 0;

   for (int i=1; i<=h->GetNbinsX(); i++) {
      for (int j=1; j<=h->GetNbinsY(); j++) {
         double xc = h->GetXaxis()->GetBinCenter(i);
         double yc = h->GetYaxis()->GetBinCenter(j);
         if (cutg->IsInside(xc, yc)) {
            integral += h->GetBinContent(i, j);
         }
      }
   }

   std::cout << "Integral inside cut region : " << integral << std::endl;


   TCanvas c1{};
   h->Draw();
   cutg->Draw("SAME");
   c1.SaveAs("plot.png");

   delete file;
}
The output is:
Integral of full histogram : 662288
Integral inside cut region : 175007
Hope this helps!
Jonas