Hi everyone,
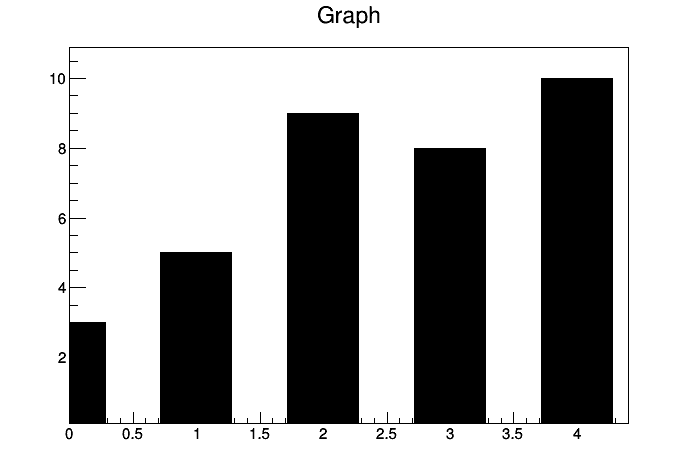
Is there a way to set different colors for each bar when using the “AB” draw option in TGraph?
Int_t y[4] = {5,9,8,10}
Int_t x[4] = {1,2,3,4}

TGraph *gr = new TGraph(4,x,y)
gr->Draw("AB");
Hi everyone,
Is there a way to set different colors for each bar when using the “AB” draw option in TGraph?
Int_t y[4] = {5,9,8,10}
Int_t x[4] = {1,2,3,4}
TGraph *gr = new TGraph(4,x,y)
gr->Draw("AB");
you need one TGraph for each bar. You can group them in a multigraph
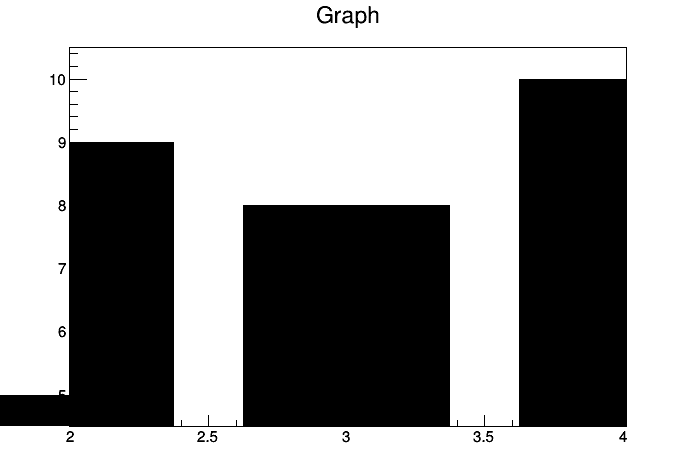
Hi @couet, I found a glitch when using "AB" Option and SetRangeUser, look:
Int_t y[4] = {5,9,8,10};
Int_t x[4] = {1,2,3,4};

TCanvas *c1 = new TCanvas();

TGraph *gr = new TGraph(4,x,y);
gr->GetXaxis()->SetRangeUser(2.,4.);
gr->Draw("AB");
c1->Print("me.png");
Which yields to:
ROOT 6.13/01

I see it too. I tried to find a work around without success.
As you need bar chart why don’t you use an histogram instead of a graph ?
with histogram you control the bin width … not with graphs (there is no bin).
This option B for graphs is rarely used because of that. But I agree it should be fixed.
I saw that, Thanks !
This topic was automatically closed 14 days after the last reply. New replies are no longer allowed.
Now fixed in master.