Rebinning of 2D ROOT histogram in Python

Hello,

I have 2 1D histograms X and Y. I need to rebin Y and plot this rebinned Y and the X as a 2D histogram which Y vs X. Could someone help with the code in Python?

Please forgive me as I am a newbie in PyROOT.

Thanks.

If you already put the data into two separate 1D histograms, you have thrown away all correlation information, so whatever you do, you can never get the full X vs Y histogram again (unless you get it as a 2D histogram in the first place).

Hello,

I have obtained 2 histograms which are TH1D and now I need to rebin one and find the TH2D. It is not that I have separated it.
Now I dont understand how to rebin one and plot the rebinned Y and X unbinned together in a TH2D.

I hope it is more clear now as to what I am trying to do.

A 2D histogram needs the 2D information (in other words, how does X change when Y changes). This information is not there anymore when you have two 1D histograms. You are basically assuming they are independent. Getting the full 2D histogram from the 2 1D histograms is mathematically impossible, unless you know the exact relationship between the two variables.

You should create a 2D histogram, with the correct binning, and then fill this 2D histogram from your data-source, for example like this:

histo_2d = ROOT.TH2F("histo_2d", "X vs Y", 100, -10, 10, 20, 0, 20)
tree.Project("histo_2d", "x:y", "", "col")
1 Like

@Graipher I have particles and X1D histo represents the X position and Y1D histo represents the Y position. Now I need to put them together as a 2D histo. I think it is possible. Isn’t it?

Ah, you basically want to make a graph afterwards, not a 2D histogram! A 2D histogram has a value for every combination of X and Y values. A graph just has a point at specific XY-coordinates.

You can do something like this:

import numpy as np

# Get the histograms for x, y, rebin them, etc
...

# put the values into arrays
x_values = np.array(histo_x)
y_values = np.array(histo_y)
assert len(x_values) == len(y_values)

# make a graph
graph = ROOT.TGraph(len(x_values), x_values, y_values)
graph.Draw("AL")

This is still not possible.

For example, you cannot know if the low values of x correspond to the low values of y, or the high values (slope positive or negative). Having the two distributions does provide some information about what situations can be excluded, but will not provide a single relation between x and y.

Take this example:

{
   TH2D* h2d_A = new TH2D("h2d_A","Dist A", 100, -2, 2, 100, -2, 2);
   TH2D* h2d_B = new TH2D("h2d_B","Dist B", 100, -2, 2, 100, -2, 2);

   for (int i=0;i<5000;i++) {
      double xValue = gRandom->Gaus();
      h2d_A->Fill(xValue, xValue);
      h2d_B->Fill(xValue, -xValue);
   }

   TCanvas *c = new TCanvas("c","");
   c->Divide(3,2);

   c->cd(1);
   h2d_A->Draw("COLZ");
   c->cd(2);
   h2d_A->ProjectionX()->Draw();
   c->cd(3);
   h2d_A->ProjectionY()->Draw();

   c->cd(4);
   h2d_B->Draw("COLZ");
   c->cd(5);
   h2d_B->ProjectionX()->Draw();
   c->cd(6);
   h2d_B->ProjectionY()->Draw();
}

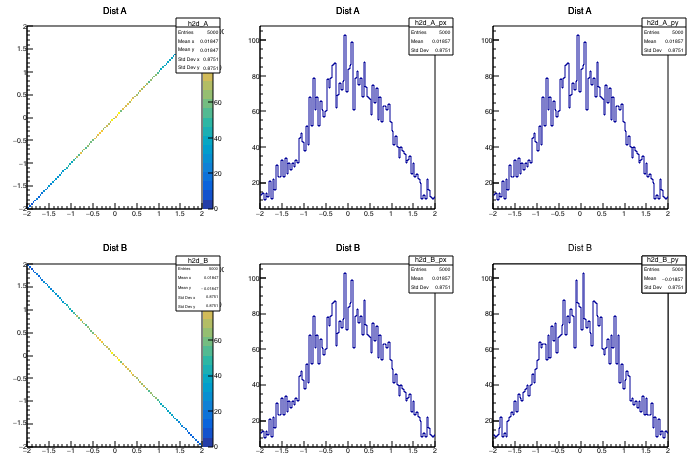
You can see that both the positive and negative sloped 2D histogram produce Gaussian projections with no indication of the correlation between the two values.

1 Like

This topic was automatically closed 14 days after the last reply. New replies are no longer allowed.