So I decided to investigate further and found this happens with the graph……
from this code
{
void HistyIssue() {
vector<double> Xvals{ 1,10,100,1000,10000,1e5,1e6,1e7,1e8 };
vector<double> Yvals{ 1,10,100,1000,10000,1e5,1e6,1e7,1e8 };
int dtpoints = (int)(Xvals.size()*Yvals.size());
TH2F* test = new TH2F("test", "test", Xvals.size() - 1, &(Xvals[0]), Yvals.size() - 1, &(Yvals[0]));
double* X = new double[dtpoints];
double* Y = new double[dtpoints];
double* Z = new double[dtpoints];
for (int i = 0; i < (int)Xvals.size(); i++) {
for (int j=0; j < (int)Yvals.size(); j++) {
// for the tgraph
int itt = i * (int)Xvals.size() + j;
X[itt] = Xvals[i];
Y[itt] = Yvals[j];
Z[itt] = TMath::Power(10,i);
//fill hist
test->Fill(Xvals[i], Yvals[j], Z[itt]);
}
}
TCanvas* C1 = new TCanvas();
C1->Divide(4);
//hist
C1->cd(1);
gPad->SetLogx(); gPad->SetLogy(); gPad->SetLogz();
test->SetMarkerSize(1);
test->SetMarkerStyle(20);
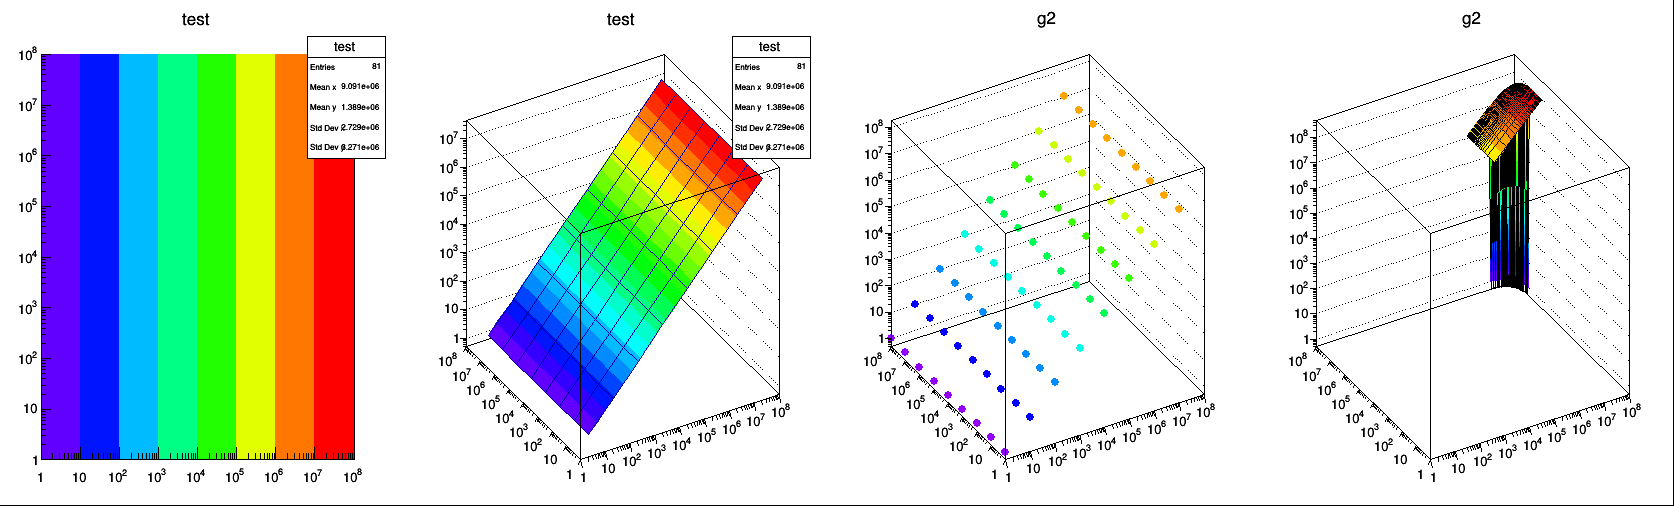
test->Draw("Pcol");
C1->cd(2);
gPad->SetLogx(); gPad->SetLogy(); gPad->SetLogz();
test->Draw("Surf1");
//another proof of madness
TGraph2D* g2 = new TGraph2D("g2", "g2", dtpoints-1, X, Y, Z);
C1->cd(3);
gPad->SetLogx(); gPad->SetLogy(); gPad->SetLogz();
g2->SetMarkerSize(1);
g2->SetMarkerStyle(20);
g2->Draw("Pcol");
C1->cd(4);
gPad->SetLogx(); gPad->SetLogy(); gPad->SetLogz();
g2->Draw("Surf1");
}
}
does the ‘surf’ option do some sort of averaging over and area?