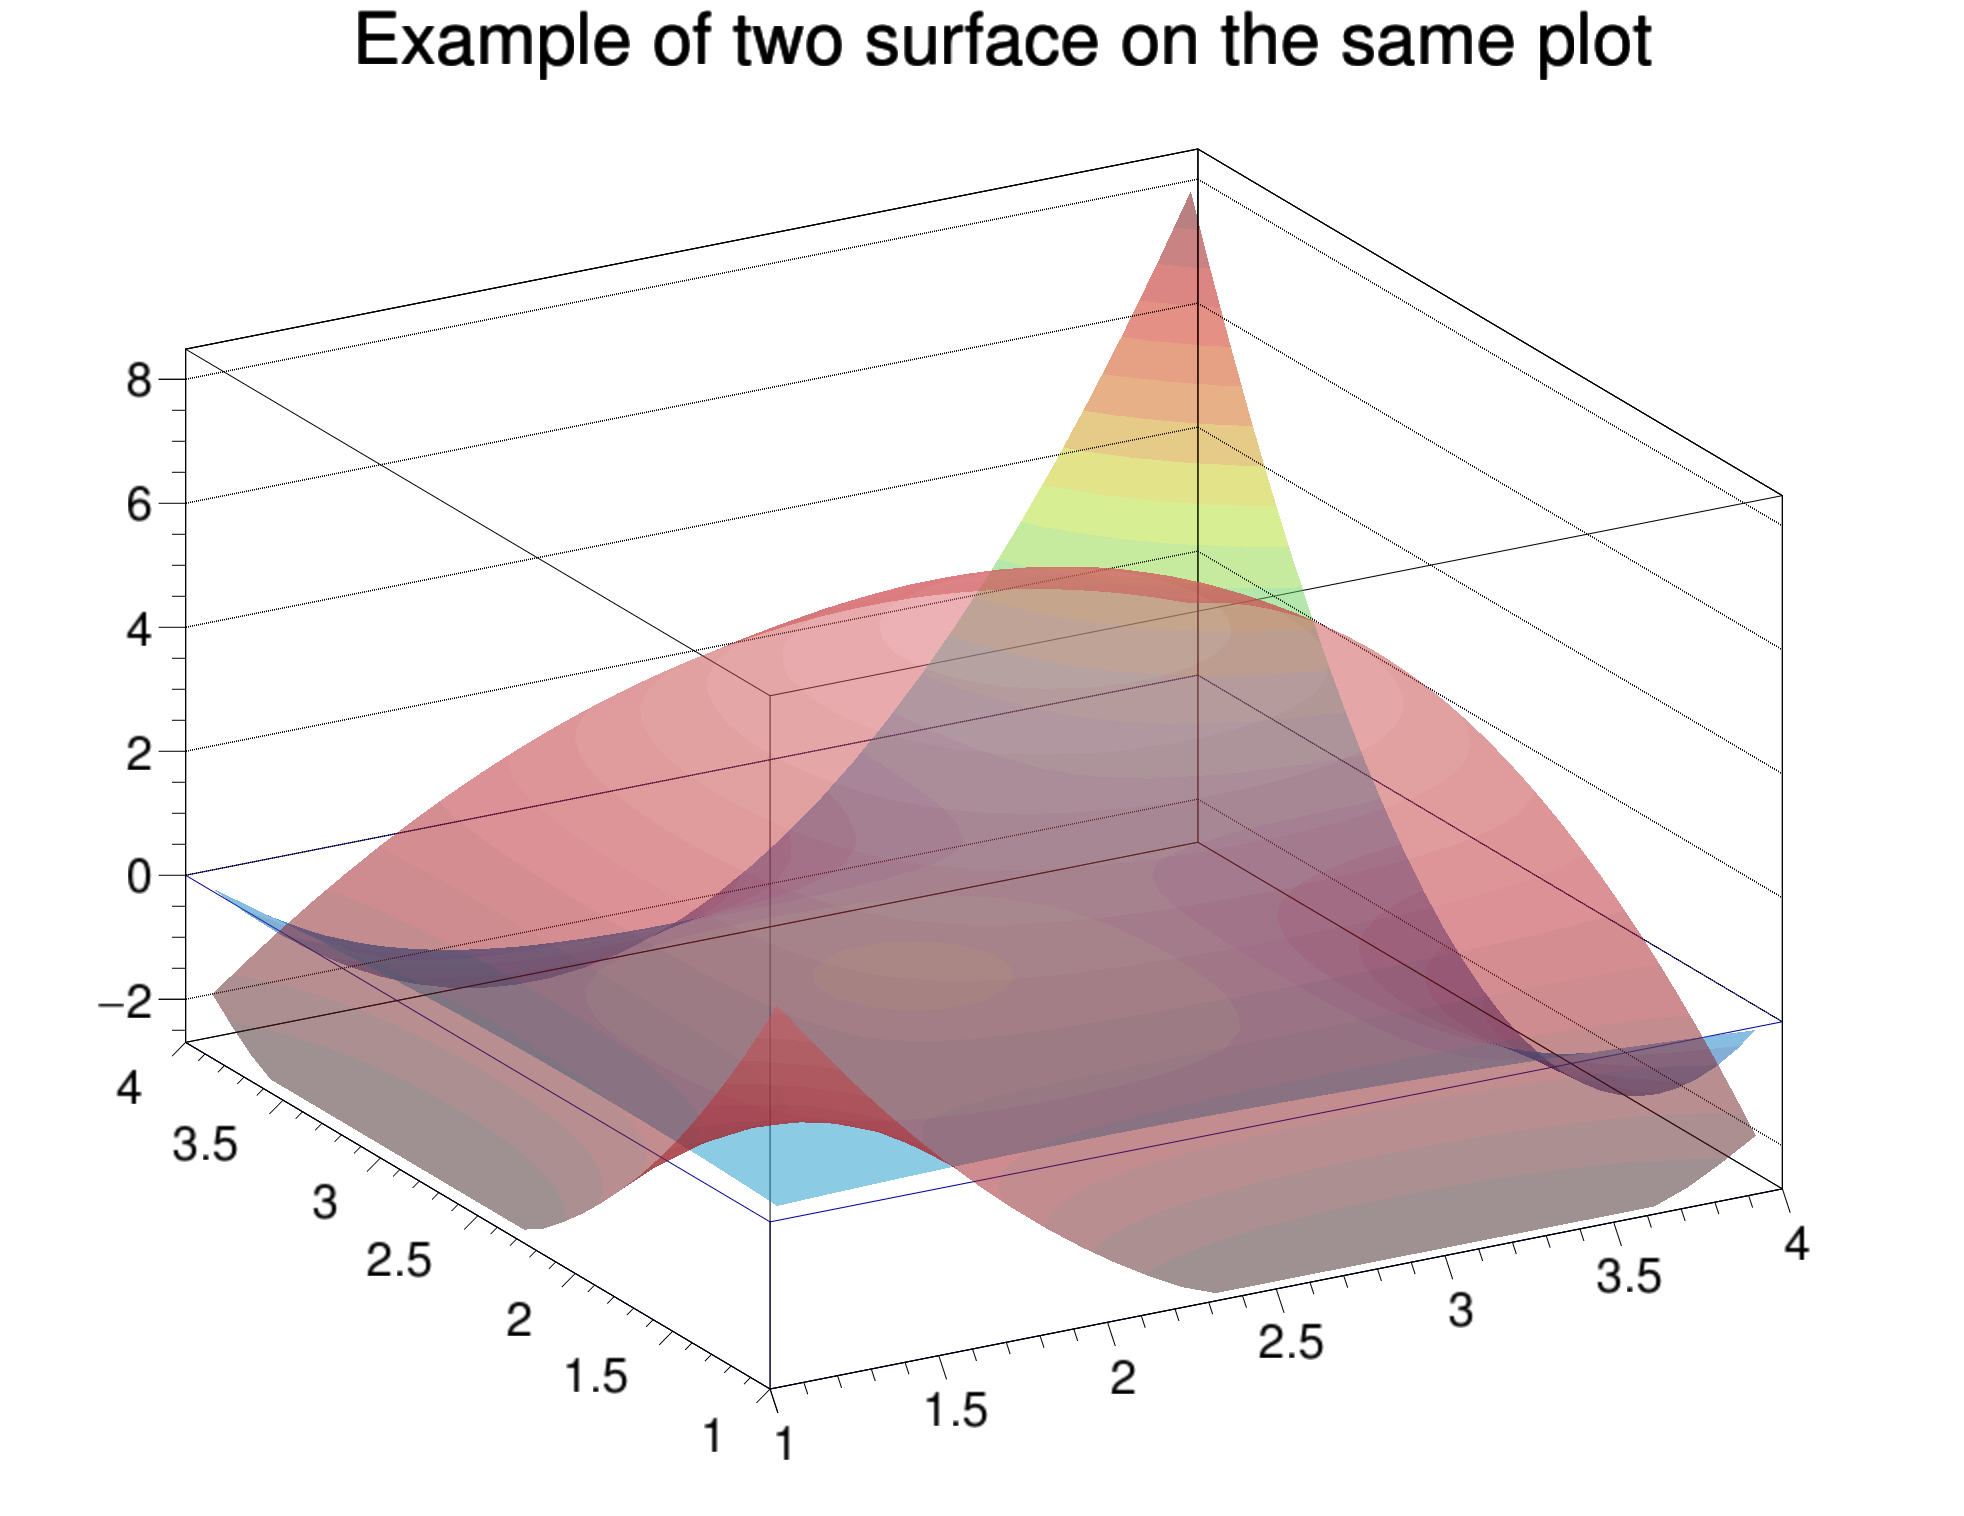
To be complete on the graphics side: one should be also careful that all the histograms you are superimposing on the same plot have exactly the same ranges in all directions. Here is the version of the macro doing that. multi5.C (1.1 KB)
and the plot is:

With data.txt I uploaded earlier, why with TGraph2DErrors I am not getting error bars drawn?
Can I directly read with TGraph2DErrors from a file?
er.cxx (2.4 KB)
@couet There is a bug in the TGraph2DErrors class. It uses the TGraph2D::RemovePoint method while it should have its own implementation for this method which also removes the corresponding “point errors” … JIRA -> ROOT / ROOT-10695
@Sandy Sorry, due to the above bug, for the time being you must use “#if 0” for the part which removes points if “z” <= “zmin”.
Here’s a modified version which does it properly in another way:
fit.cxx (1.9 KB)
@Wile_E_Coyote: Can you make a Jira ticket with that ? I will look at it asap. I am on something else right now.
Thanks. That’s nice.
Dear @couet
What I am seeing that only 52, 53, and 55 are giving color transparency.
Anyway, I have a request:
Since this QA series was more about plotting, could you please remove only the function part in my first post? As that functional form is under research, I do not want to disclose that. Thank you for your understanding.
You should be allowed to remove/edit all your posts.
So you want me to remove the data file and the code from your very first post ?
Done.
Thanks a lot.
Dear @Wile_E_Coyote and @Couet,
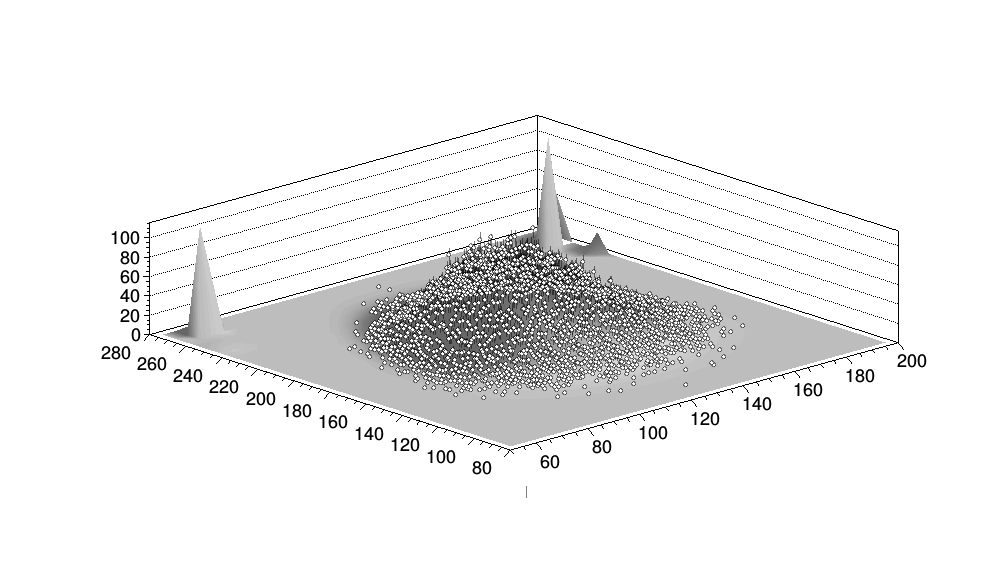
Should the peaks coming outside the fit range, be due to the (1) ill-defined fit parameters or (2) ill-defined functional form?
If the above two are correct, then is there a way to get rid of those unwanted peaks outside the fit-range?
I have tried changing the fit-range too, but, it it very difficult to remove those?
Is there any other trick to remove those?
Ok, is there any way to get the integral under TGraph2DErrors?
{like what we do for histograms…myhist->Integral(); }
Maybe you should take the integral of your fitted function?
When the function is not uniquely defined…then…!!!
You anyhow go through an “intermediate” histogram so maybe use its integral.
Otherwisse, you would need to create a TF2 from your 2D graph and integrate this new function.
An example of a TF1 created from a 1D graph can be found in: “Integral of TGraph”
Actually, what do you mean by “function is not uniquely defined”?
Your fit function is just an ordinary TF2 so you can use its TF2::Integral method.