I realize that I might not be providing sufficient info to facilitate a solution and do apologize for the same. The data files on which the code works are inconveniently sized for sharing.
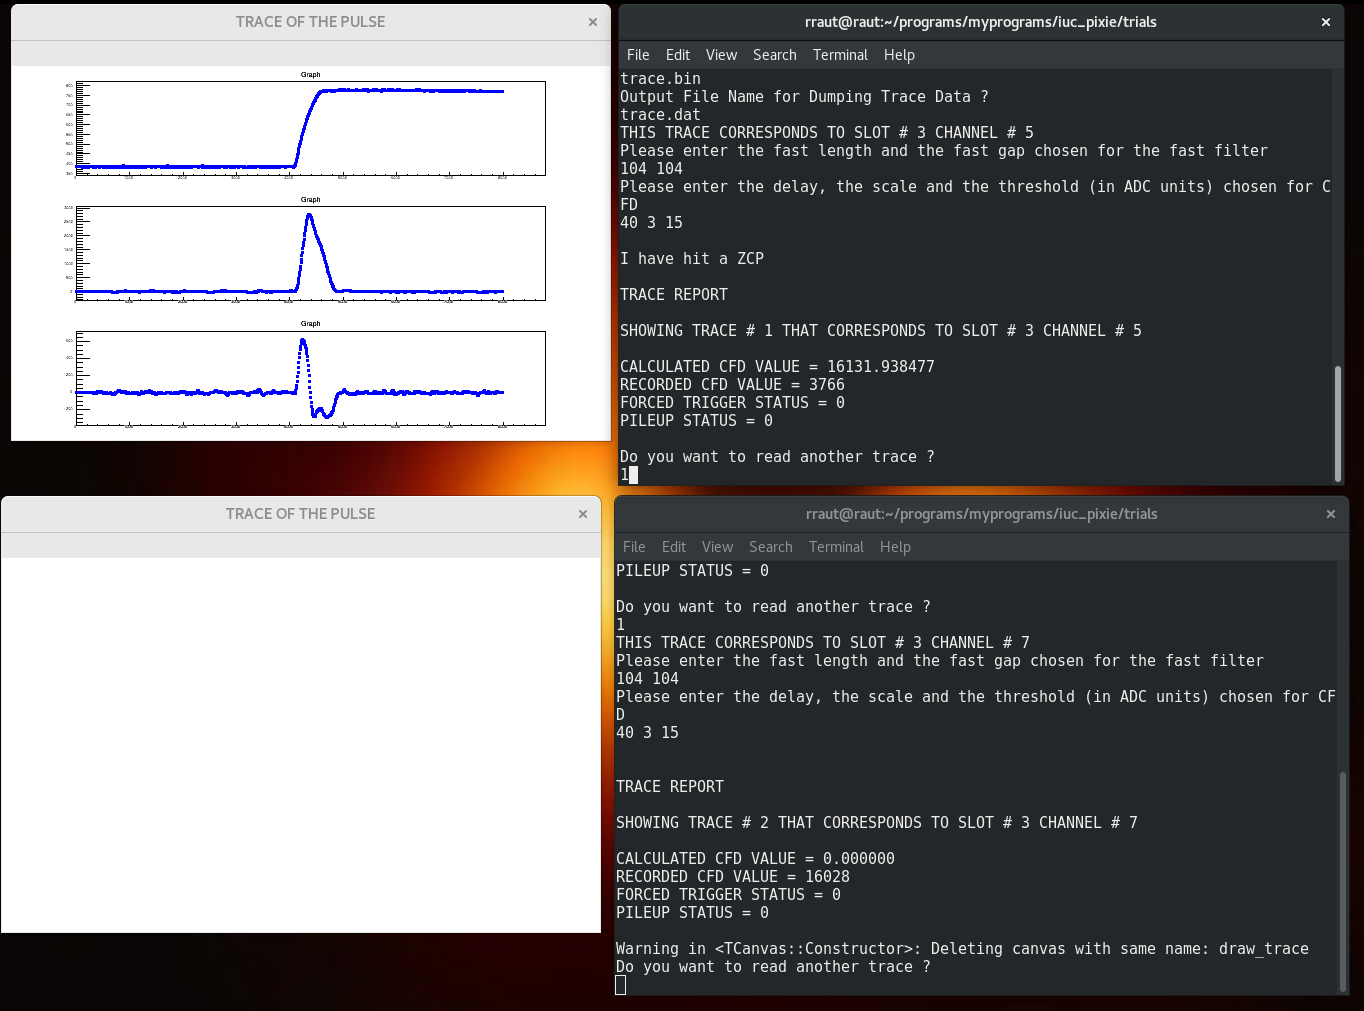
In the absence of such options, I’m uploading the screenshots that might represent the problem. The upper panel corresponds to the display and the command window after the first set of data points are read/calculated while the lower panel corresponds to the (blank) display and the command window that I see on trying to plot the second set.
May I also mention that I’m compiling this code with,
g++ -o trace6 trace6.cpp root-config --cflags --libs
and using it thereafter.
Please let me know if I should provide additional info in order to enable a solution. Deeply appreciating your inputs.